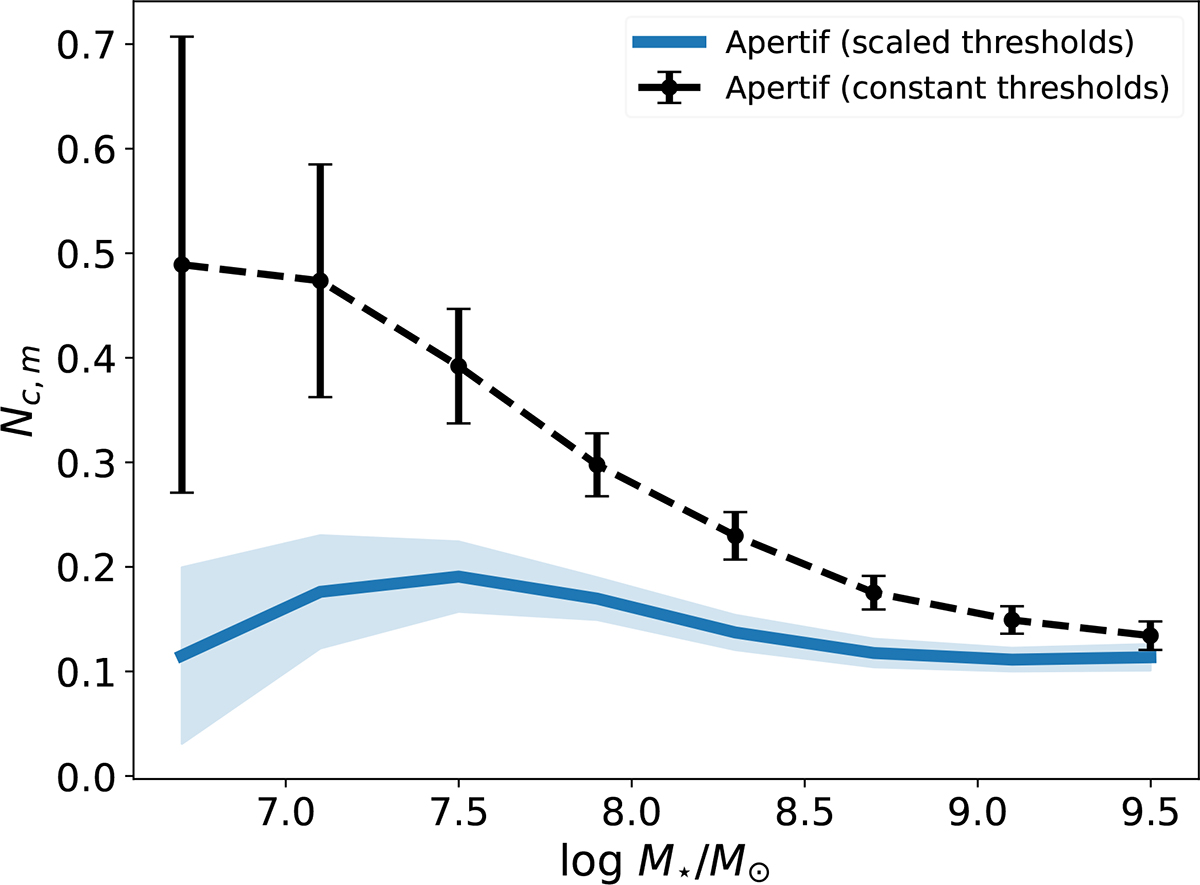
Fig. 5.
Download original image
Mean number of companions (of any stellar mass) per dwarf galaxy in the logarithmic stellar mass bin, normalized by the number of dwarfs in the same mass bin. Values represent the mean between different realizations of the sample in each mass bin. The black line represents results obtained using constant thresholds in projected distance and systemic velocity difference (150 kpc and 150 km s−1, respectively) for selection of companions, while the blue line represents results obtained using the mass-scaled thresholds (see Sect. 4.1). Both lines represent results for the total drawn dwarf galaxy sample. Shaded regions and error bars represent 1σ errors.
Current usage metrics show cumulative count of Article Views (full-text article views including HTML views, PDF and ePub downloads, according to the available data) and Abstracts Views on Vision4Press platform.
Data correspond to usage on the plateform after 2015. The current usage metrics is available 48-96 hours after online publication and is updated daily on week days.
Initial download of the metrics may take a while.