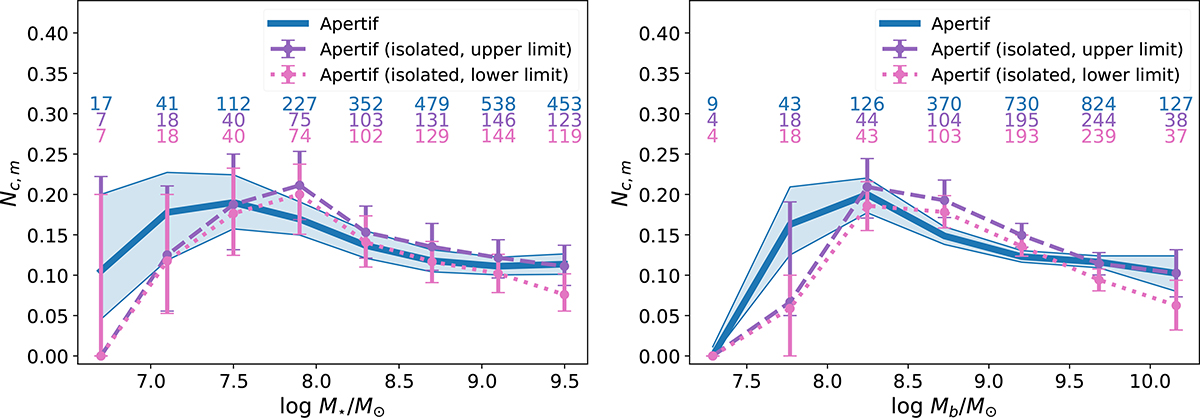
Fig. 6.
Download original image
Mean number of companions (of any stellar and/or baryonic mass) per dwarf in logarithmic stellar (left) or baryonic (right) mass bins, normalized by the number of dwarfs per bin. Values represent the median between different realizations of the sample in each mass bin. All lines are obtained using mass-scaled thresholds (see Sect. 4.1): the blue line represents the total drawn dwarf galaxy sample, the dashed purple line the isolated drawn sample including split multiples (upper limit), and the dotted pink line the isolated drawn sample excluding split multiples (lower limit). Shaded regions and error bars indicate 1σ uncertainties. The number of galaxies in each bin is shown at the top, with font colors and order matching the corresponding lines in the legend.
Current usage metrics show cumulative count of Article Views (full-text article views including HTML views, PDF and ePub downloads, according to the available data) and Abstracts Views on Vision4Press platform.
Data correspond to usage on the plateform after 2015. The current usage metrics is available 48-96 hours after online publication and is updated daily on week days.
Initial download of the metrics may take a while.