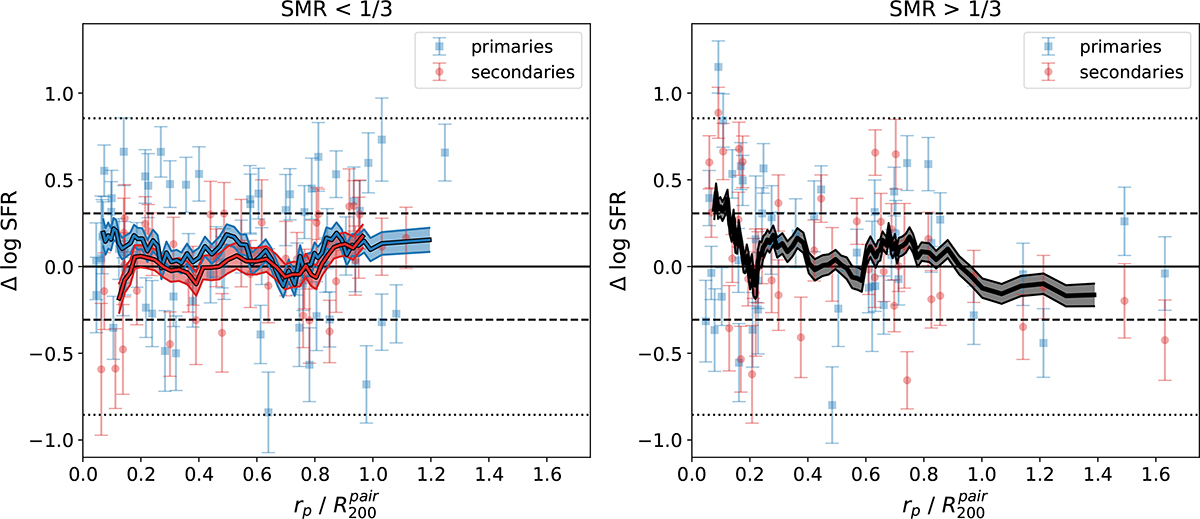
Fig. 7.
Download original image
Difference in the SFRs of paired galaxies with respect to the unpaired control sample vs. the pair separation scaled by the virial radius of the pair. Left: pairs with stellar mass ratios below 1/3. Primaries correspond to the more massive galaxy in a pair and are denoted by blue squares, while secondaries (the less massive in a pair) are denoted by red circles. Blue and red lines correspond to the running means for primaries and secondaries, respectively, with 1σ errors on the means denoted as shaded regions. Horizontal dashed and dotted black lines denote the 1σ and 2σ scatter of unpaired galaxies. Right: pairs with stellar mass ratios above 1/3. The notation is the same as in the left panel, except that the running mean (black line) is calculated by taking primary and secondary galaxies together.
Current usage metrics show cumulative count of Article Views (full-text article views including HTML views, PDF and ePub downloads, according to the available data) and Abstracts Views on Vision4Press platform.
Data correspond to usage on the plateform after 2015. The current usage metrics is available 48-96 hours after online publication and is updated daily on week days.
Initial download of the metrics may take a while.