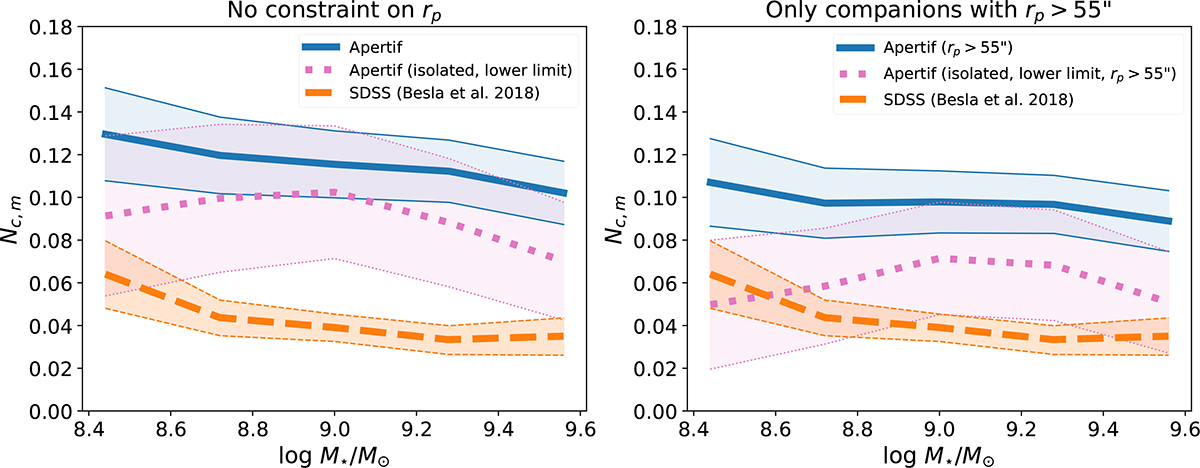
Fig. 8.
Download original image
Comparison of the mean number of companions per dwarf between the Apertif and the SDSS samples. Left: case with no constraint on the projected radius between companions in Apertif. The blue line represents the result for the total drawn galaxy sample; the dotted pink represents the results from the isolated drawn sample by taking the lower limit (see Sect. 5.1); and the dashed orange line represents results from B18. Shaded regions represent 1σ errors. Right: same as in the left panel, but excluding all companions in Apertif for which rp < 55″.
Current usage metrics show cumulative count of Article Views (full-text article views including HTML views, PDF and ePub downloads, according to the available data) and Abstracts Views on Vision4Press platform.
Data correspond to usage on the plateform after 2015. The current usage metrics is available 48-96 hours after online publication and is updated daily on week days.
Initial download of the metrics may take a while.