Fig. 10.
Download original image
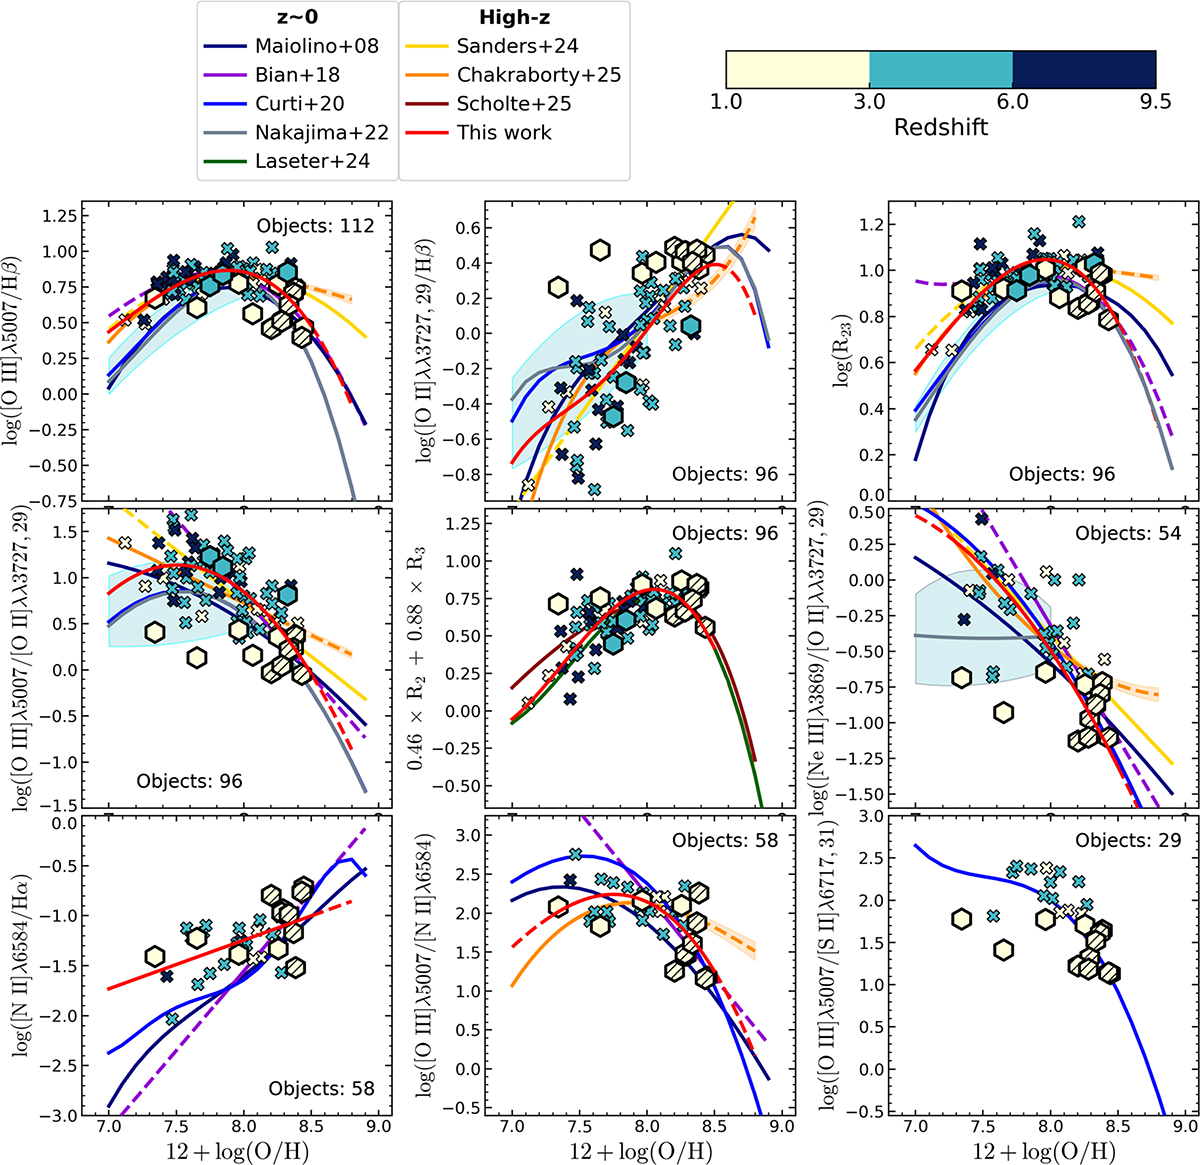
Nine different strong-line diagnostics comparing our MARTA data (striped hexagons for the golden sample, plain hexagons for the silver) with high-z literature samples (crosses) and a set of empirical calibrations. The data are colour-coded by redshift bin. The high-redshift data include strong-line calibration measurements from JWST surveys (D’Eugenio et al. 2024; Navarro-Carrera et al. 2024; Sanders et al. 2024; Schaerer et al. 2024; Arellano-Córdova et al. 2025; Curti et al. 2025b; Morishita et al. 2025; Napolitano et al. 2025; Scholte et al. 2025; Stiavelli et al. 2025; Topping et al. 2025b). The empirical calibration curves from the local Universe are from Maiolino et al. (2008), Bian et al. (2018), Curti et al. (2020a), and Nakajima et al. (2022), colour-coded in a dark colour palette (blue, purple, green), while the high-redshift-based calibrations from Sanders et al. (2024) and Chakraborty et al. (2025) are represented with a warm colour palette (yellow, orange, and red). Dashed lines denote extrapolations of the calibrations outside the regime where they have been calibrated. Our best-fit relations to the high-redshift dataset are shown in red. In most cases, a third-degree polynomial was used; for the N2 and R2 diagnostics, we adopted a linear fit, as there were no particular features that required a higher-order polynomial. Furthermore, in the ![]() panel (central one), the Laseter et al. (2024) and Scholte et al. (2025) empirical re-calibration are displayed as well.
panel (central one), the Laseter et al. (2024) and Scholte et al. (2025) empirical re-calibration are displayed as well.
Current usage metrics show cumulative count of Article Views (full-text article views including HTML views, PDF and ePub downloads, according to the available data) and Abstracts Views on Vision4Press platform.
Data correspond to usage on the plateform after 2015. The current usage metrics is available 48-96 hours after online publication and is updated daily on week days.
Initial download of the metrics may take a while.