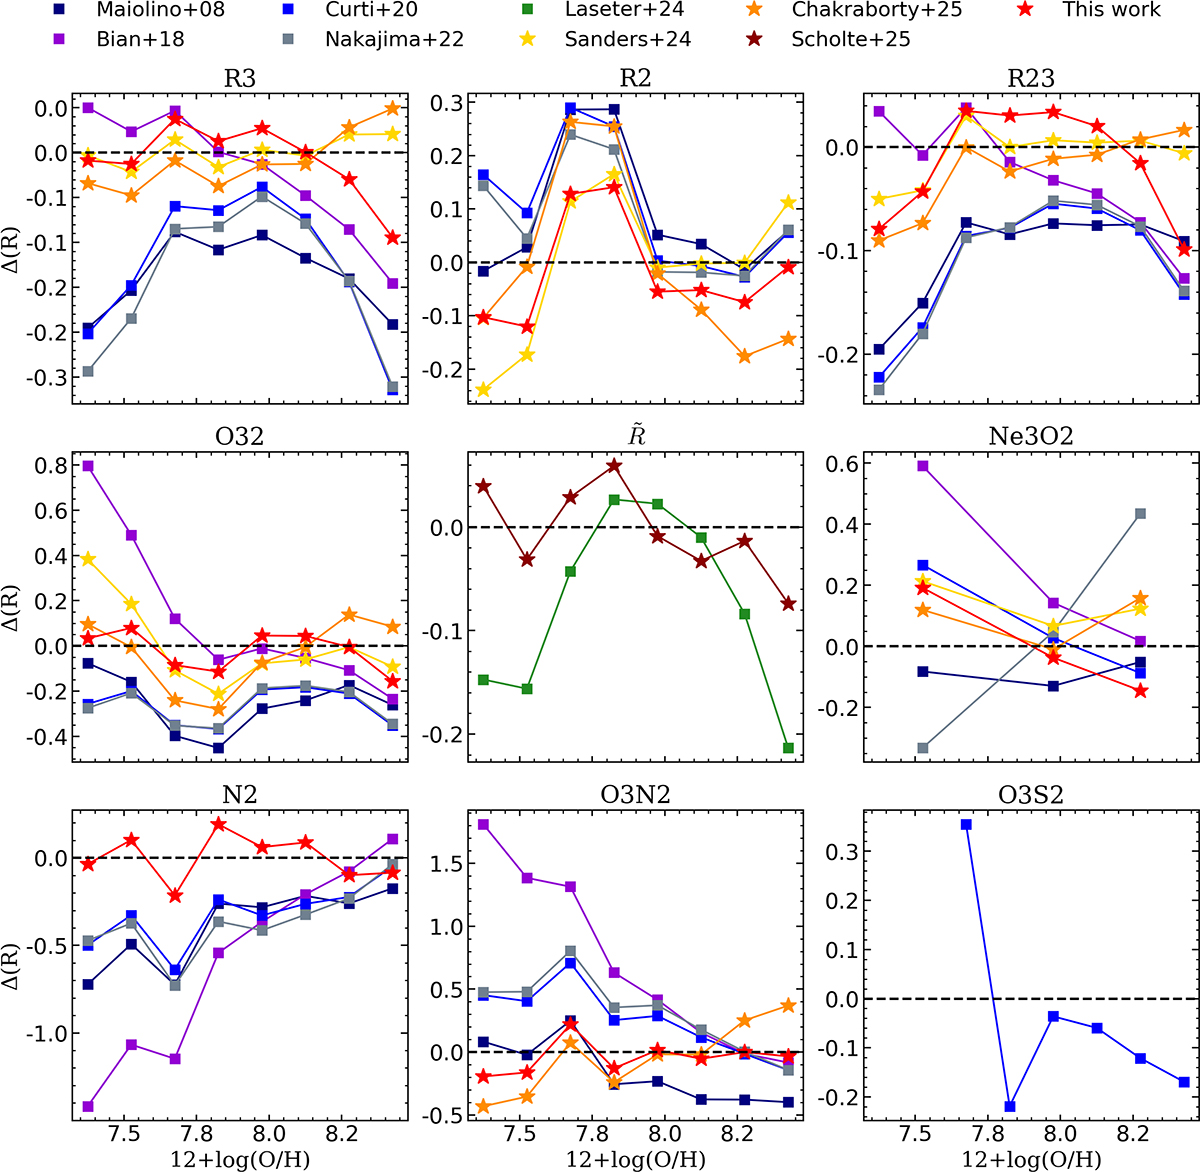
Fig. 11.
Download original image
Median offset of the strong-line calibrations analysed in this work relative to the high-z sample (z ∼ 1 − 9.5), computed in bins of metallicity. The bins have a width of 0.15 dex and are included only if they contain at least five objects. Each panel corresponds to a different diagnostic. The colour palette is the same as used in Fig. 10 to distinguish between low-z and high-z based calibrations, with markers also representing this division: stars for high-z and squares for z ∼ 0 based calibrations.
Current usage metrics show cumulative count of Article Views (full-text article views including HTML views, PDF and ePub downloads, according to the available data) and Abstracts Views on Vision4Press platform.
Data correspond to usage on the plateform after 2015. The current usage metrics is available 48-96 hours after online publication and is updated daily on week days.
Initial download of the metrics may take a while.