Open Access
Fig. 12.
Download original image
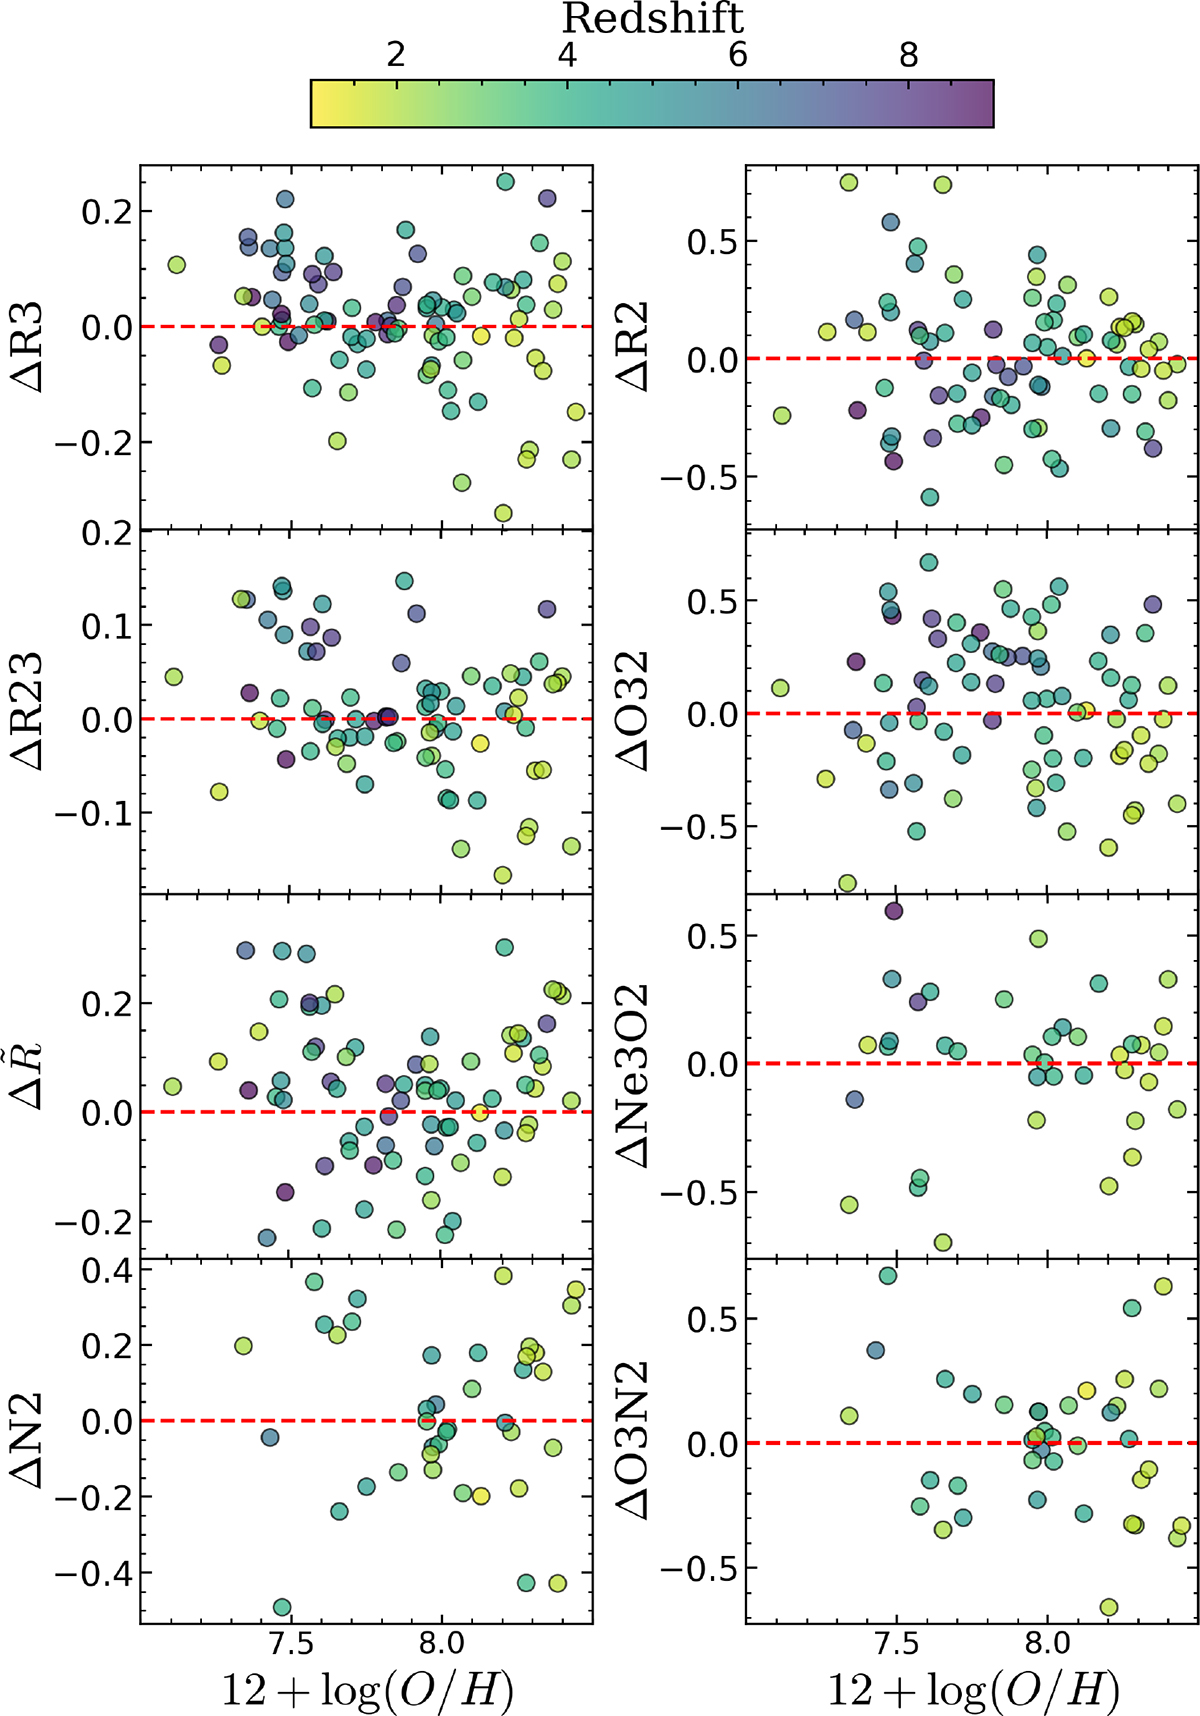
Offsets in the log of the chosen line ratio at fixed O/H, representing the difference between the observed ratio and the value predicted by our best-fit calibrations. High-z JWST sample points are colour-coded by redshift to highlight potential trends.
Current usage metrics show cumulative count of Article Views (full-text article views including HTML views, PDF and ePub downloads, according to the available data) and Abstracts Views on Vision4Press platform.
Data correspond to usage on the plateform after 2015. The current usage metrics is available 48-96 hours after online publication and is updated daily on week days.
Initial download of the metrics may take a while.