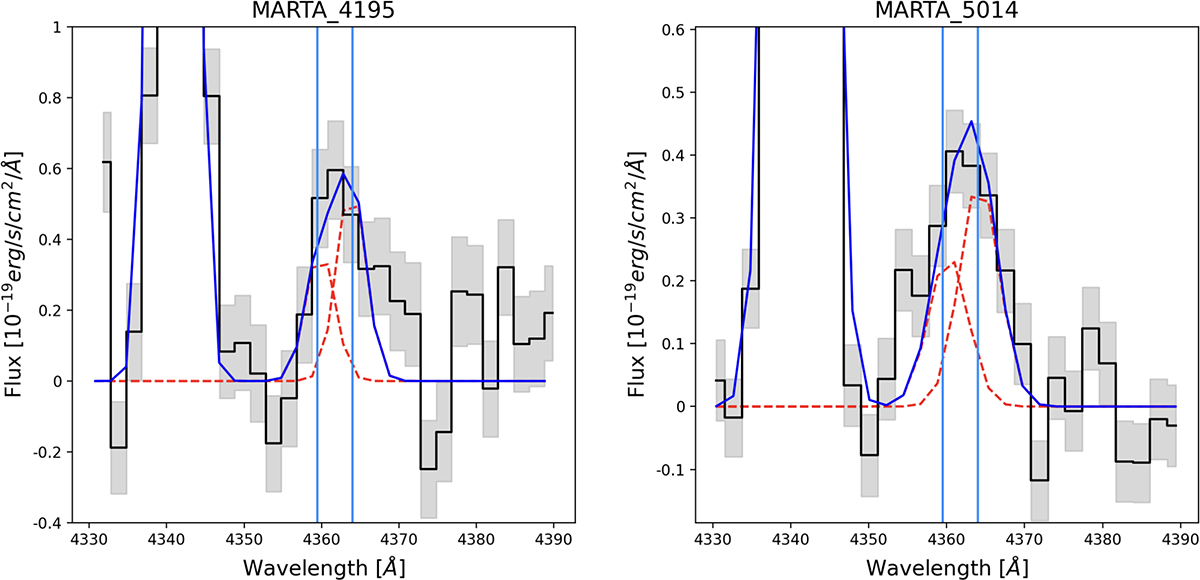
Fig. B.1.
Download original image
Spectral fits in the region around the [O III] λ4363 line that contains three emission lines (Hγ, [Fe II] λ4360, and [O III] λ4363) for galaxies 4195 (left panel) and 5014 (right panel). The overall fit is represented by the solid blue line, while the two Gaussian components centred at 4360 and 4364 Å are shown as dashed red lines. The fit demonstrates that a single Gaussian at 4364 Å alone cannot adequately reproduce the spectral features of these two galaxies. The inclusion of the [Fe II] component provides a significantly better fit.
Current usage metrics show cumulative count of Article Views (full-text article views including HTML views, PDF and ePub downloads, according to the available data) and Abstracts Views on Vision4Press platform.
Data correspond to usage on the plateform after 2015. The current usage metrics is available 48-96 hours after online publication and is updated daily on week days.
Initial download of the metrics may take a while.