Open Access
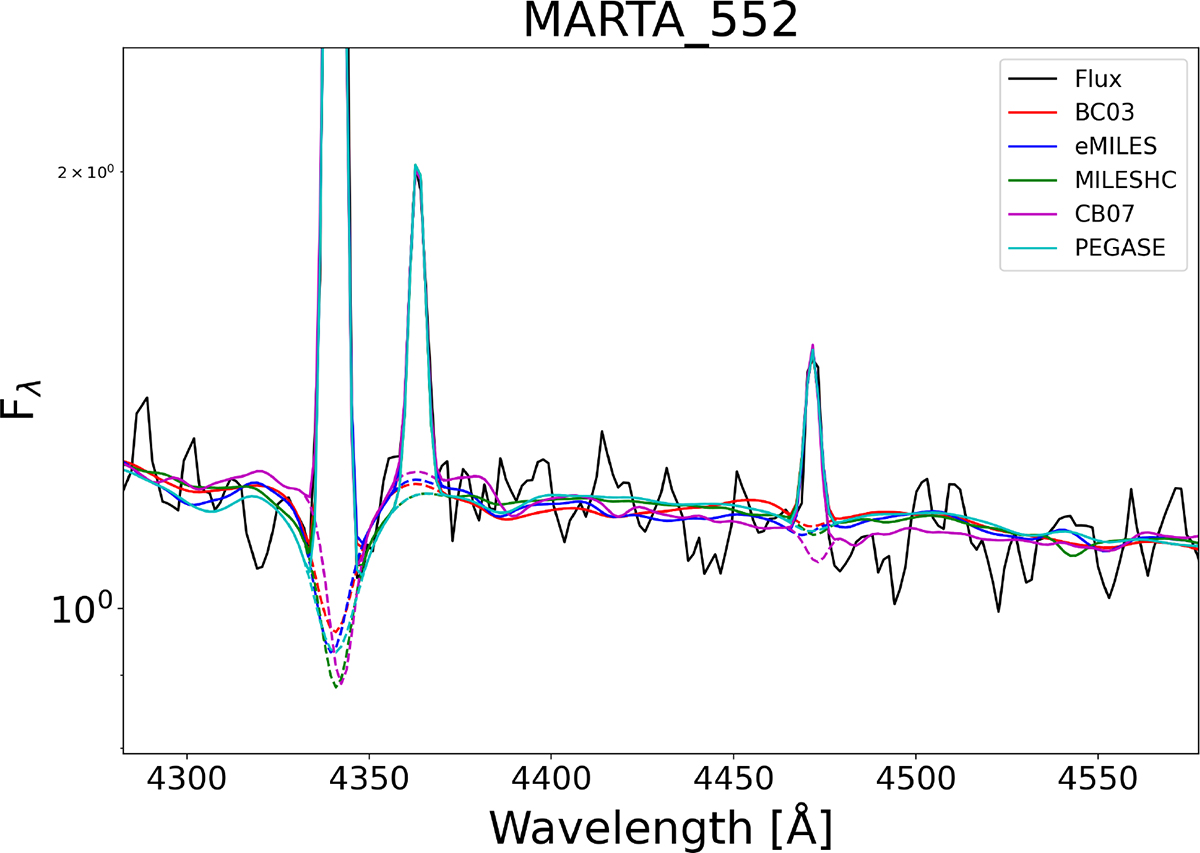
Fig. B.2.
Download original image
Example continuum fits for a representative object – MARTA_552 – using different stellar population synthesis templates. The figure illustrates the variation in the modelled absorption feature under the Hγ, and the corresponding stability of the [O III] λ4363 emission line flux.
Current usage metrics show cumulative count of Article Views (full-text article views including HTML views, PDF and ePub downloads, according to the available data) and Abstracts Views on Vision4Press platform.
Data correspond to usage on the plateform after 2015. The current usage metrics is available 48-96 hours after online publication and is updated daily on week days.
Initial download of the metrics may take a while.