Fig. C.1.
Download original image
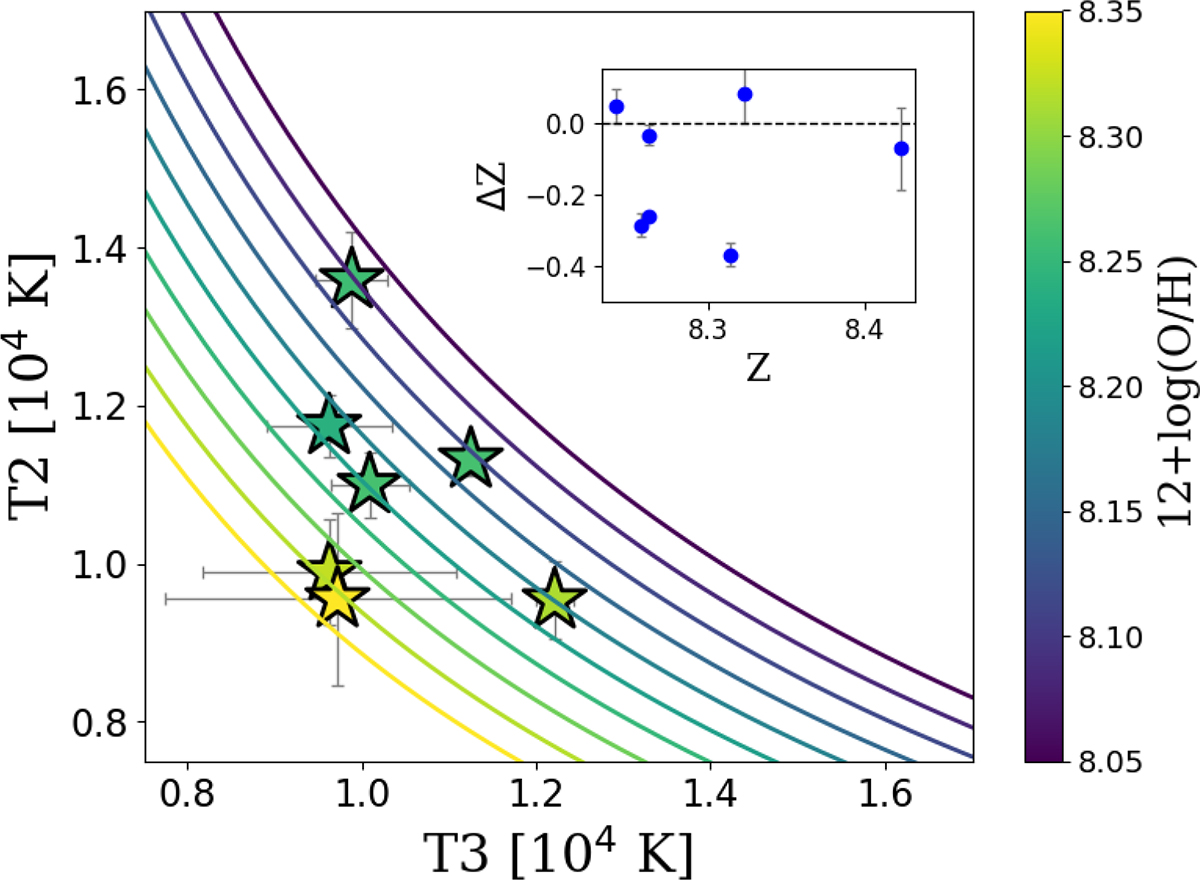
Parametrisation of the T2-T3 plane from Yates et al. (2020). MARTA galaxies are overplotted, colour-coded by their Te-based metallicity. The solid lines represent the T-T relation calibrated by Yates et al. (2020) for a fixed metallicity. Inset panel: ΔZ vs Z plot, where Z is the metallicity derived from the Te method for the MARTA objects and ΔZ is the difference between the ‘direct’ metallicity and that obtained from the Yates et al. (2020) calibration for the same galaxies.
Current usage metrics show cumulative count of Article Views (full-text article views including HTML views, PDF and ePub downloads, according to the available data) and Abstracts Views on Vision4Press platform.
Data correspond to usage on the plateform after 2015. The current usage metrics is available 48-96 hours after online publication and is updated daily on week days.
Initial download of the metrics may take a while.