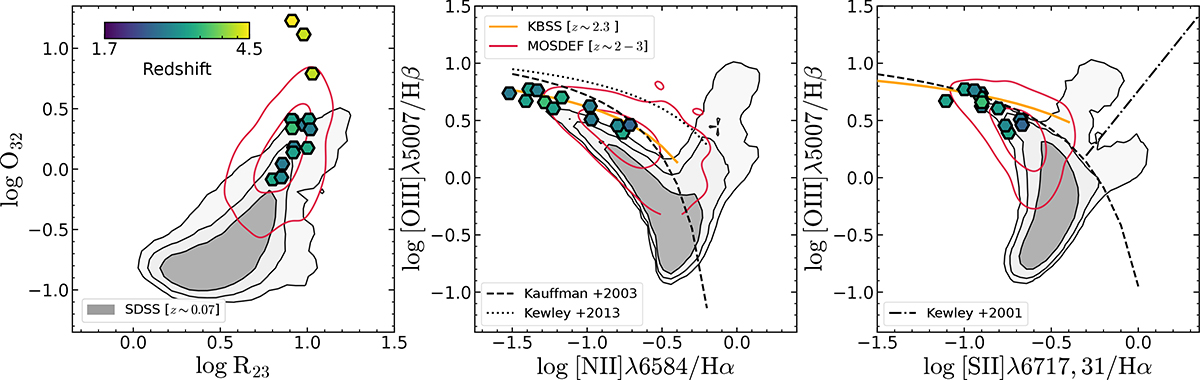
Fig. 3.
Download original image
Diagnostic diagrams for the MARTA galaxies analysed in this work. From left to right: Distribution of the combined golden and silver samples on the O32 vs R23, [O III]/Hβ vs [N II]/Hα, and [O III]/Hβ vs [S II]/Hα diagrams, colour-coded by galaxy redshift. The grey contours indicate the region populated by local galaxies from SDSS, with darker shades denoting higher densities. Red contours mark the distribution of galaxies from the MOSDEF survey (Kriek et al. 2015), whereas the orange curve is the fit to KBSS galaxies from Strom et al. (2017); both surveys target primarily z ∼ 2 − 3 systems. The dividing lines between star-forming galaxies, AGNs, and LINER galaxies from Kewley et al. (2001, 2013) and Kauffmann et al. (2003) in both the [N II]-BPT and [S II]-BPT diagrams are also drawn. Median error bars are not shown, as they are smaller than the symbol size and would not be visible in the plot; this is due to the fact that these are among the strongest lines, measured with very high S/Ns.
Current usage metrics show cumulative count of Article Views (full-text article views including HTML views, PDF and ePub downloads, according to the available data) and Abstracts Views on Vision4Press platform.
Data correspond to usage on the plateform after 2015. The current usage metrics is available 48-96 hours after online publication and is updated daily on week days.
Initial download of the metrics may take a while.