Fig. 4.
Download original image
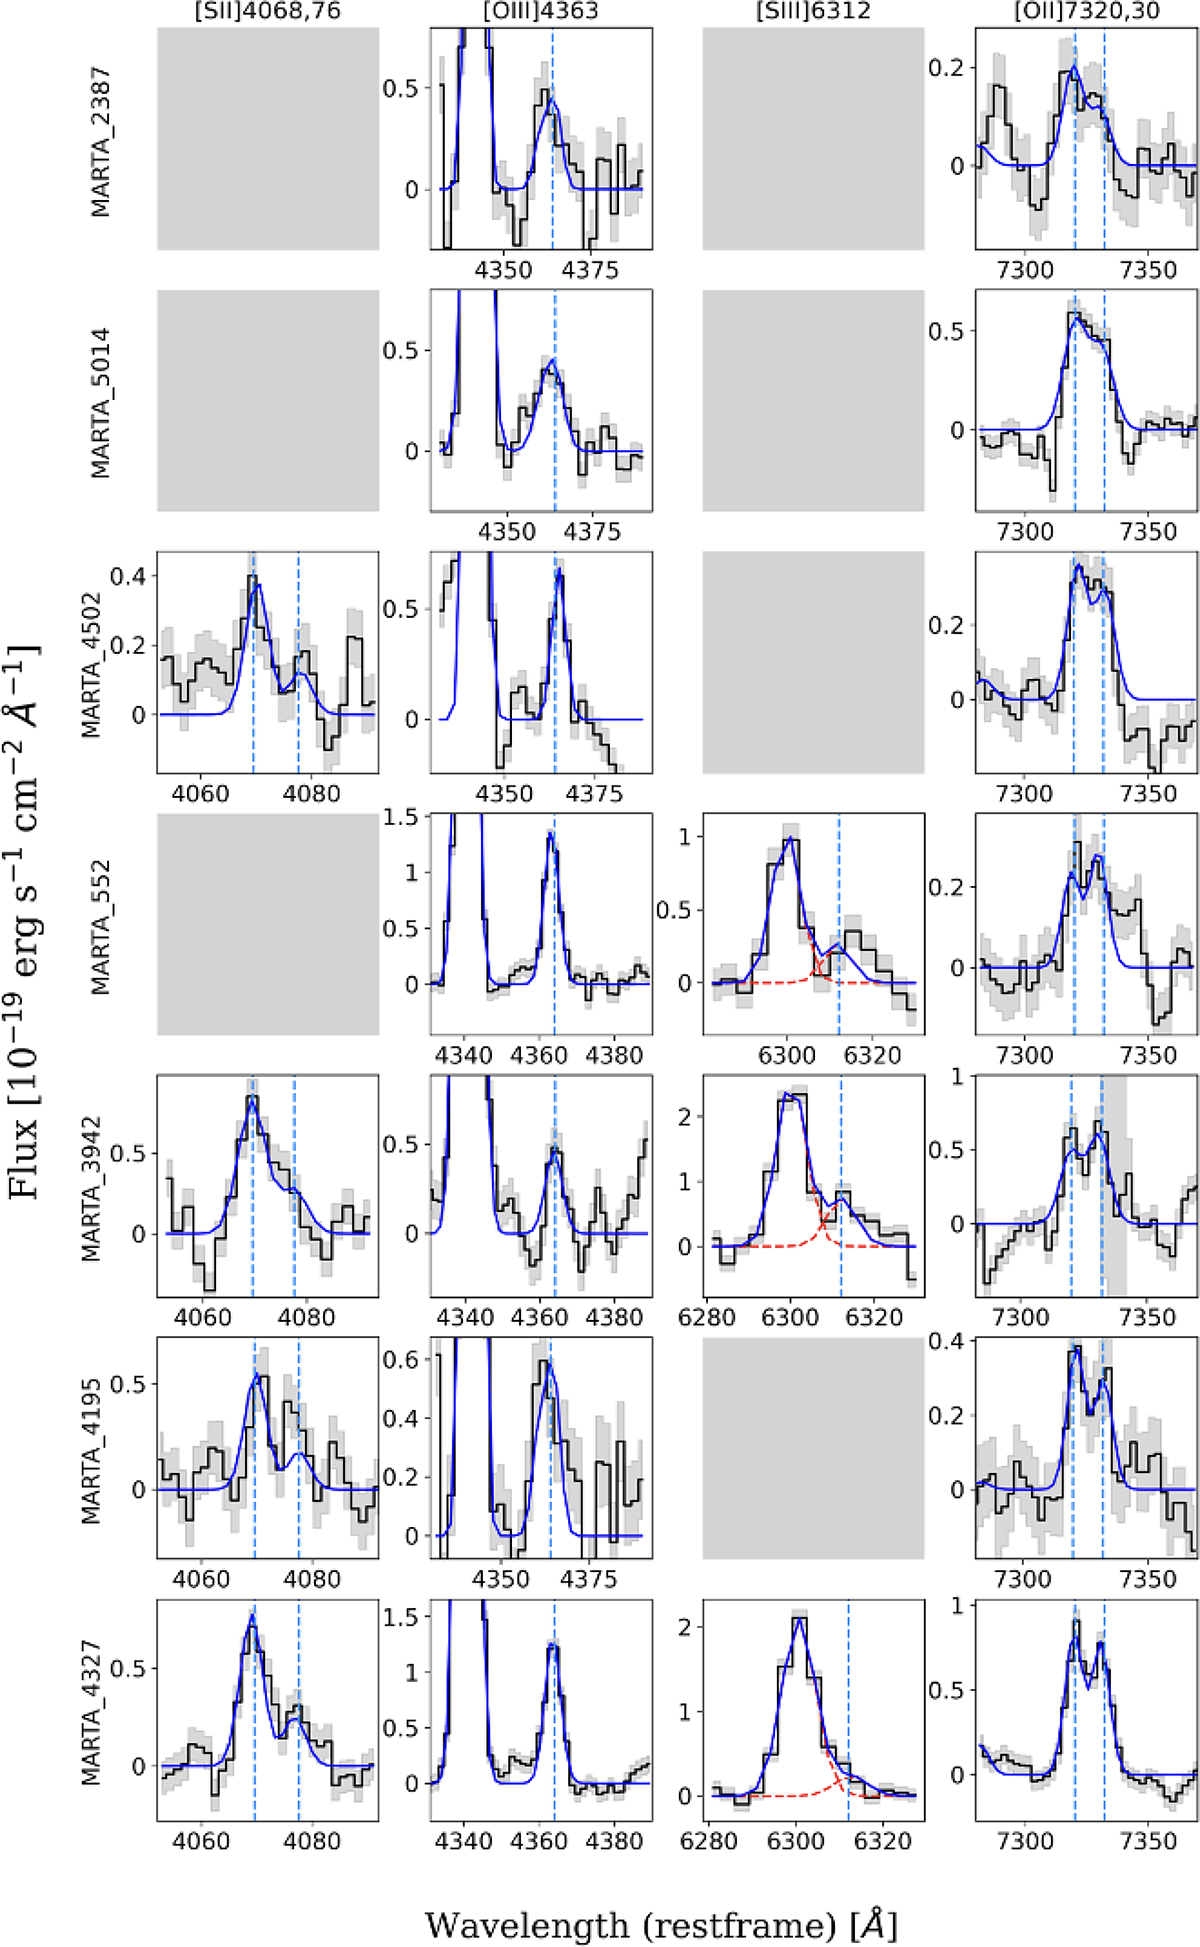
Auroral emission lines detected in the MARTA golden sample. The panels show emission line fits of the [S II] λ4068,4076, [O III] λ4363, [S III] λ6312, and [O II] λ7320,7330 transitions, with their rest-frame wavelengths marked as dashed blue lines. We show the continuum-subtracted spectra in black, and the Gaussian emission-line fits in blue. In the case of [S III] λ6312, two single Gaussians are shown (dashed red lines), since the [S III] line is blended with the [O II] λ6300.
Current usage metrics show cumulative count of Article Views (full-text article views including HTML views, PDF and ePub downloads, according to the available data) and Abstracts Views on Vision4Press platform.
Data correspond to usage on the plateform after 2015. The current usage metrics is available 48-96 hours after online publication and is updated daily on week days.
Initial download of the metrics may take a while.