Fig. 5.
Download original image
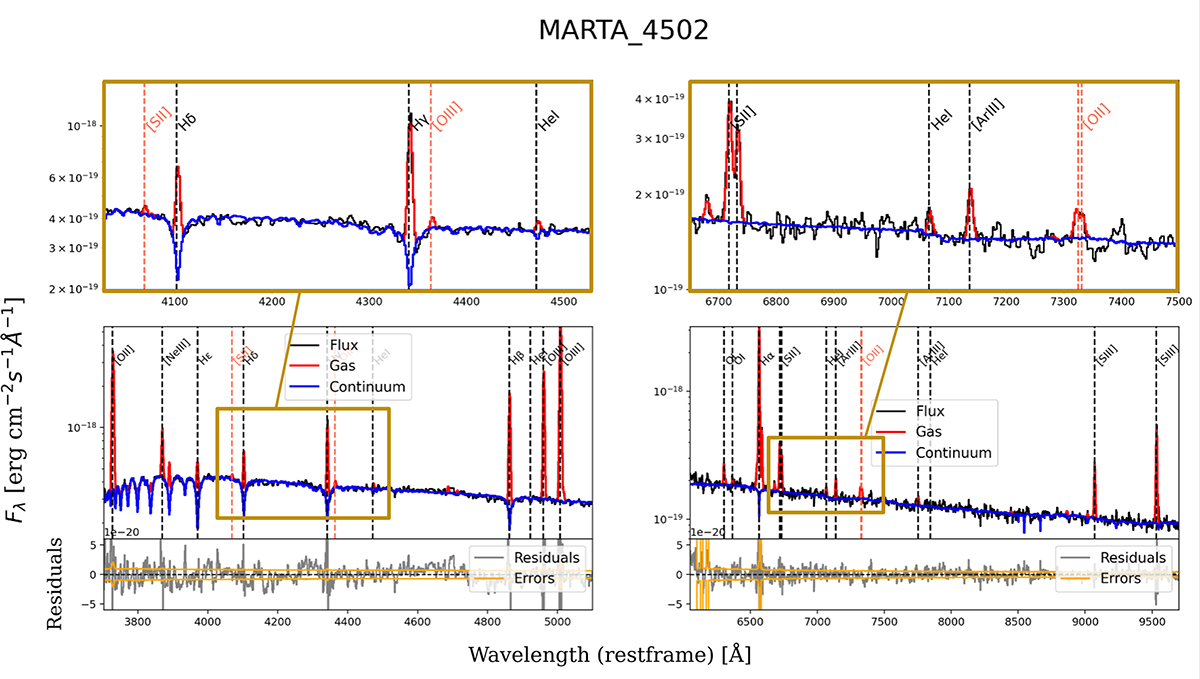
Spectral fit for MARTA_4502, observed using grating G140M (left) and G235M (right). The black line represents the observed flux, the blue line the stellar continuum fit, and the red lines the emission-line Gaussian fits. In the bottom panels we show in grey the residuals from the fit, while the orange line represents the pipeline error estimates. The zoom-in panels at the top provide a more detailed view of specific spectral features: the auroral lines [S II] λ4068 and [O III] λ4363 (left) and the spectral range around the [O II] λλ7320,7330 auroral lines (right).
Current usage metrics show cumulative count of Article Views (full-text article views including HTML views, PDF and ePub downloads, according to the available data) and Abstracts Views on Vision4Press platform.
Data correspond to usage on the plateform after 2015. The current usage metrics is available 48-96 hours after online publication and is updated daily on week days.
Initial download of the metrics may take a while.