Fig. 7.
Download original image
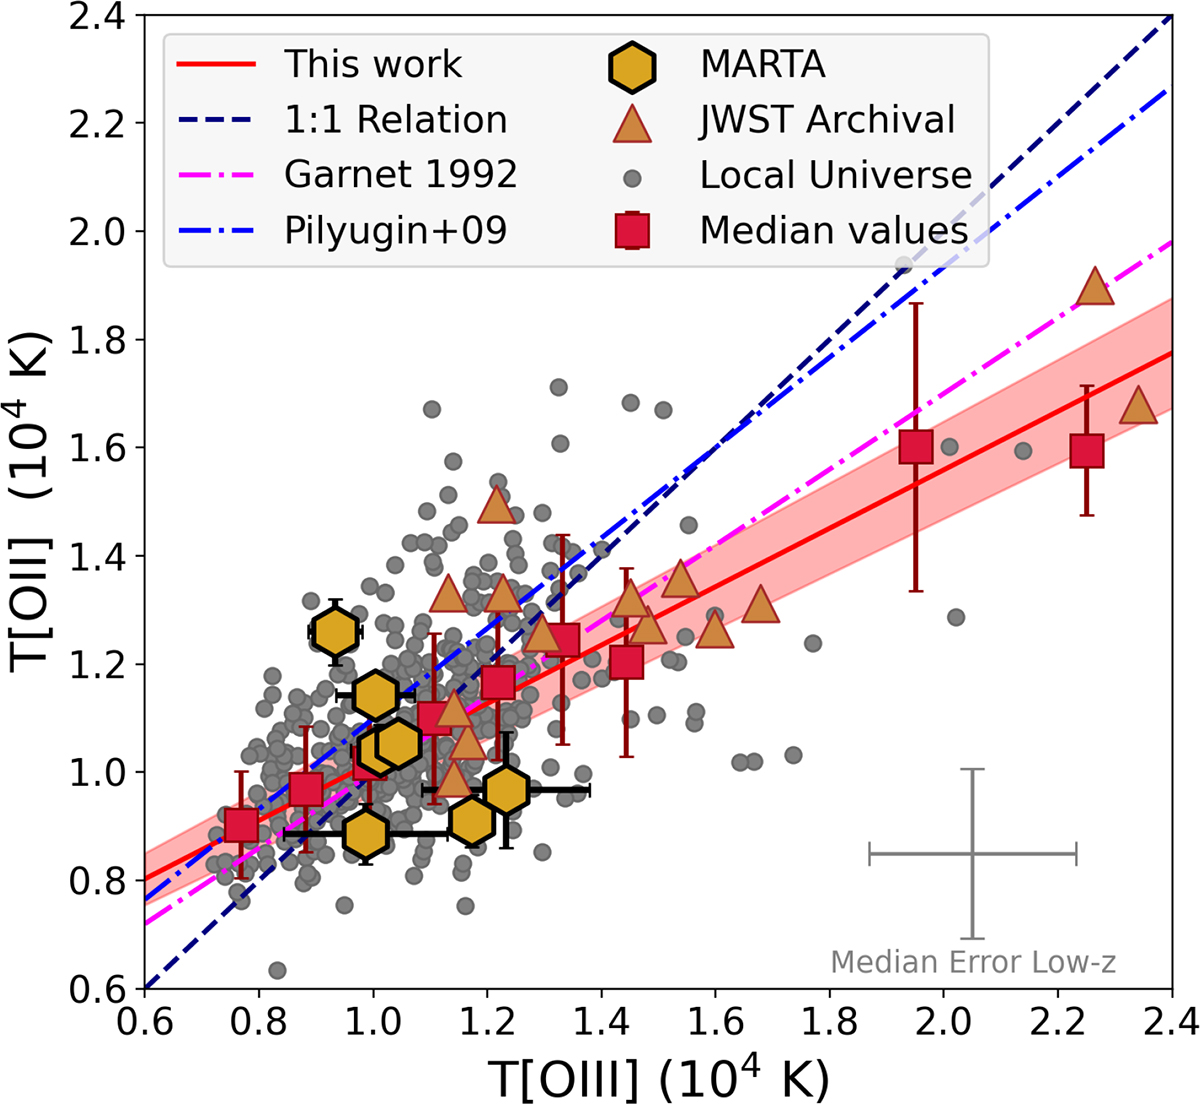
Relation between T[O III] and T[O II] for the MARTA sample (gold hexagons), compared with various samples from the literature at low (grey dots) and high redshifts (from JWST archival data, orange triangles). The plot also shows the 1:1 relation (dashed blue line) and two empirical calibrations of the T2 − T3 relation, from Pilyugin et al. (2009, dashed purple line) and Garnett (1992, dashed magenta line). The red squares represent the median values of the entire sample, binned in T3, with uncertainties given by the standard deviation within each bin. The red line shows the best-fit relation derived in this work.
Current usage metrics show cumulative count of Article Views (full-text article views including HTML views, PDF and ePub downloads, according to the available data) and Abstracts Views on Vision4Press platform.
Data correspond to usage on the plateform after 2015. The current usage metrics is available 48-96 hours after online publication and is updated daily on week days.
Initial download of the metrics may take a while.