Fig. 9.
Download original image
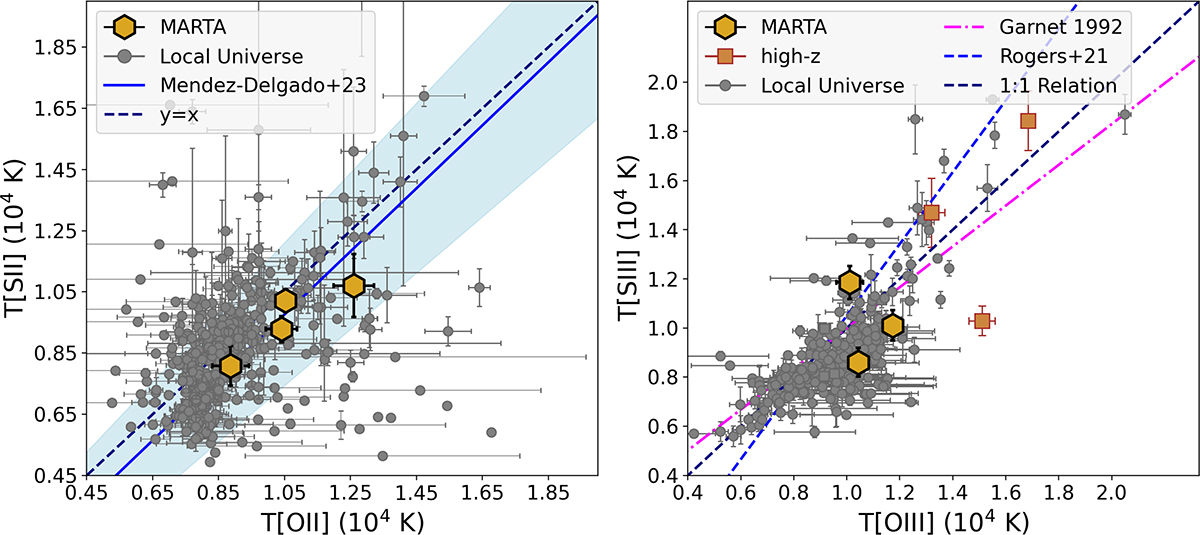
Left panel: T[S II]–T[O II] relation for MARTA objects, compared with extragalactic H II regions together with the empirical calibration by Méndez-Delgado et al. (2023b), based on local H II regions. Right panel: T[S III]–T[O III] relation for MARTA objects, along with local H II region data and two high-redshift galaxies with archival JWST data (Rogers et al. 2024; Welch et al. 2025). The plot also shows the calibrations from Garnett (1992) and Rogers et al. (2021).
Current usage metrics show cumulative count of Article Views (full-text article views including HTML views, PDF and ePub downloads, according to the available data) and Abstracts Views on Vision4Press platform.
Data correspond to usage on the plateform after 2015. The current usage metrics is available 48-96 hours after online publication and is updated daily on week days.
Initial download of the metrics may take a while.