Fig. 10.
Download original image
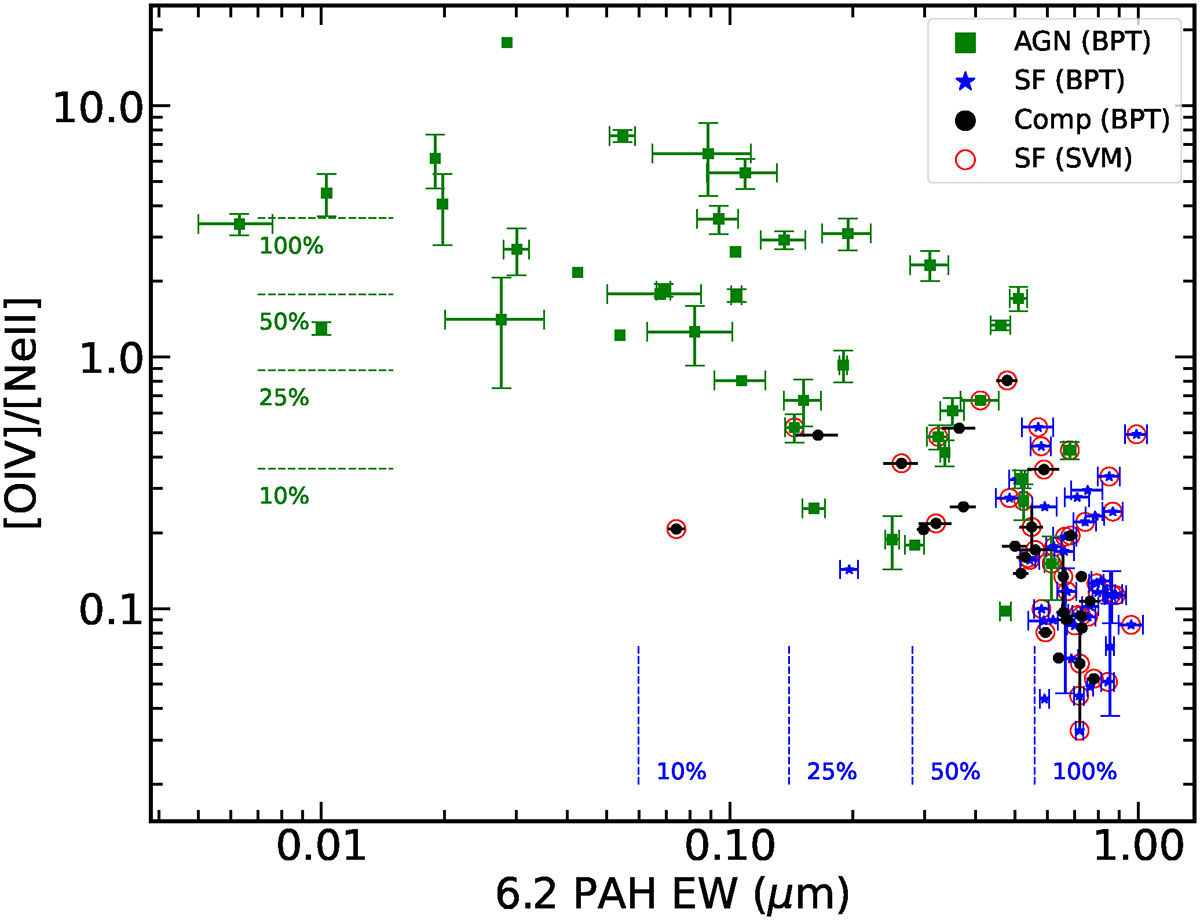
The [O IV] 25.9 μm/[Ne II] 12.8 μm ratio plotted against the EW of the 6.2 μm PAH feature for optically identified star-forming (blue stars), composite (black disks), and AGN (green squares) galaxies. The green lines represent the average AGN fractional contribution to a galaxy’s emission, based on the [O IV]/[Ne II] ratio (Sturm et al. 2002). The blue lines denote the average starburst fractional contribution determined from the EW of the 6.2 μm feature (Armus et al. 2007). The red circle highlights galaxies identified as star-forming based on our diagnostic tool. The uncertainties associated with each measurement are 1σ error.
Current usage metrics show cumulative count of Article Views (full-text article views including HTML views, PDF and ePub downloads, according to the available data) and Abstracts Views on Vision4Press platform.
Data correspond to usage on the plateform after 2015. The current usage metrics is available 48-96 hours after online publication and is updated daily on week days.
Initial download of the metrics may take a while.