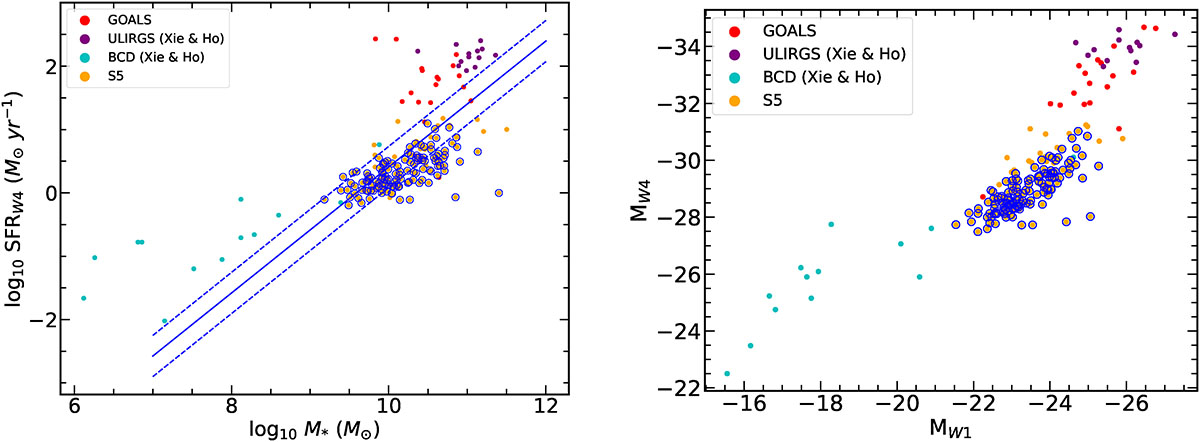
Fig. 12.
Download original image
Star formation rate against stellar mass for galaxies from several galaxy samples (left panel). We correctly identify almost all the galaxies that fall in the area on the MS star-forming galaxies. As expected, we miss all the galaxies from samples that focus on BCDs and ULIRGs. The solid blue line shows the MS fit for star-forming galaxies from Elbaz et al. (2011), and the dashed blue lines are correspond to the 1σ error to this line. On the right panel, we plot the absolute magnitude in band W4 against the absolute magnitude in band W1 for the same galaxies. The former serves as a proxy of the star formation rate, while the latter as a proxy of the stellar mass of a galaxy. The star-forming galaxies identified correctly (blue circles) are clustered on the MS, while the star-forming galaxies missed tend to have higher MW4 values or correspond to extreme cases of galaxies (BCDs or ULIRGs).
Current usage metrics show cumulative count of Article Views (full-text article views including HTML views, PDF and ePub downloads, according to the available data) and Abstracts Views on Vision4Press platform.
Data correspond to usage on the plateform after 2015. The current usage metrics is available 48-96 hours after online publication and is updated daily on week days.
Initial download of the metrics may take a while.