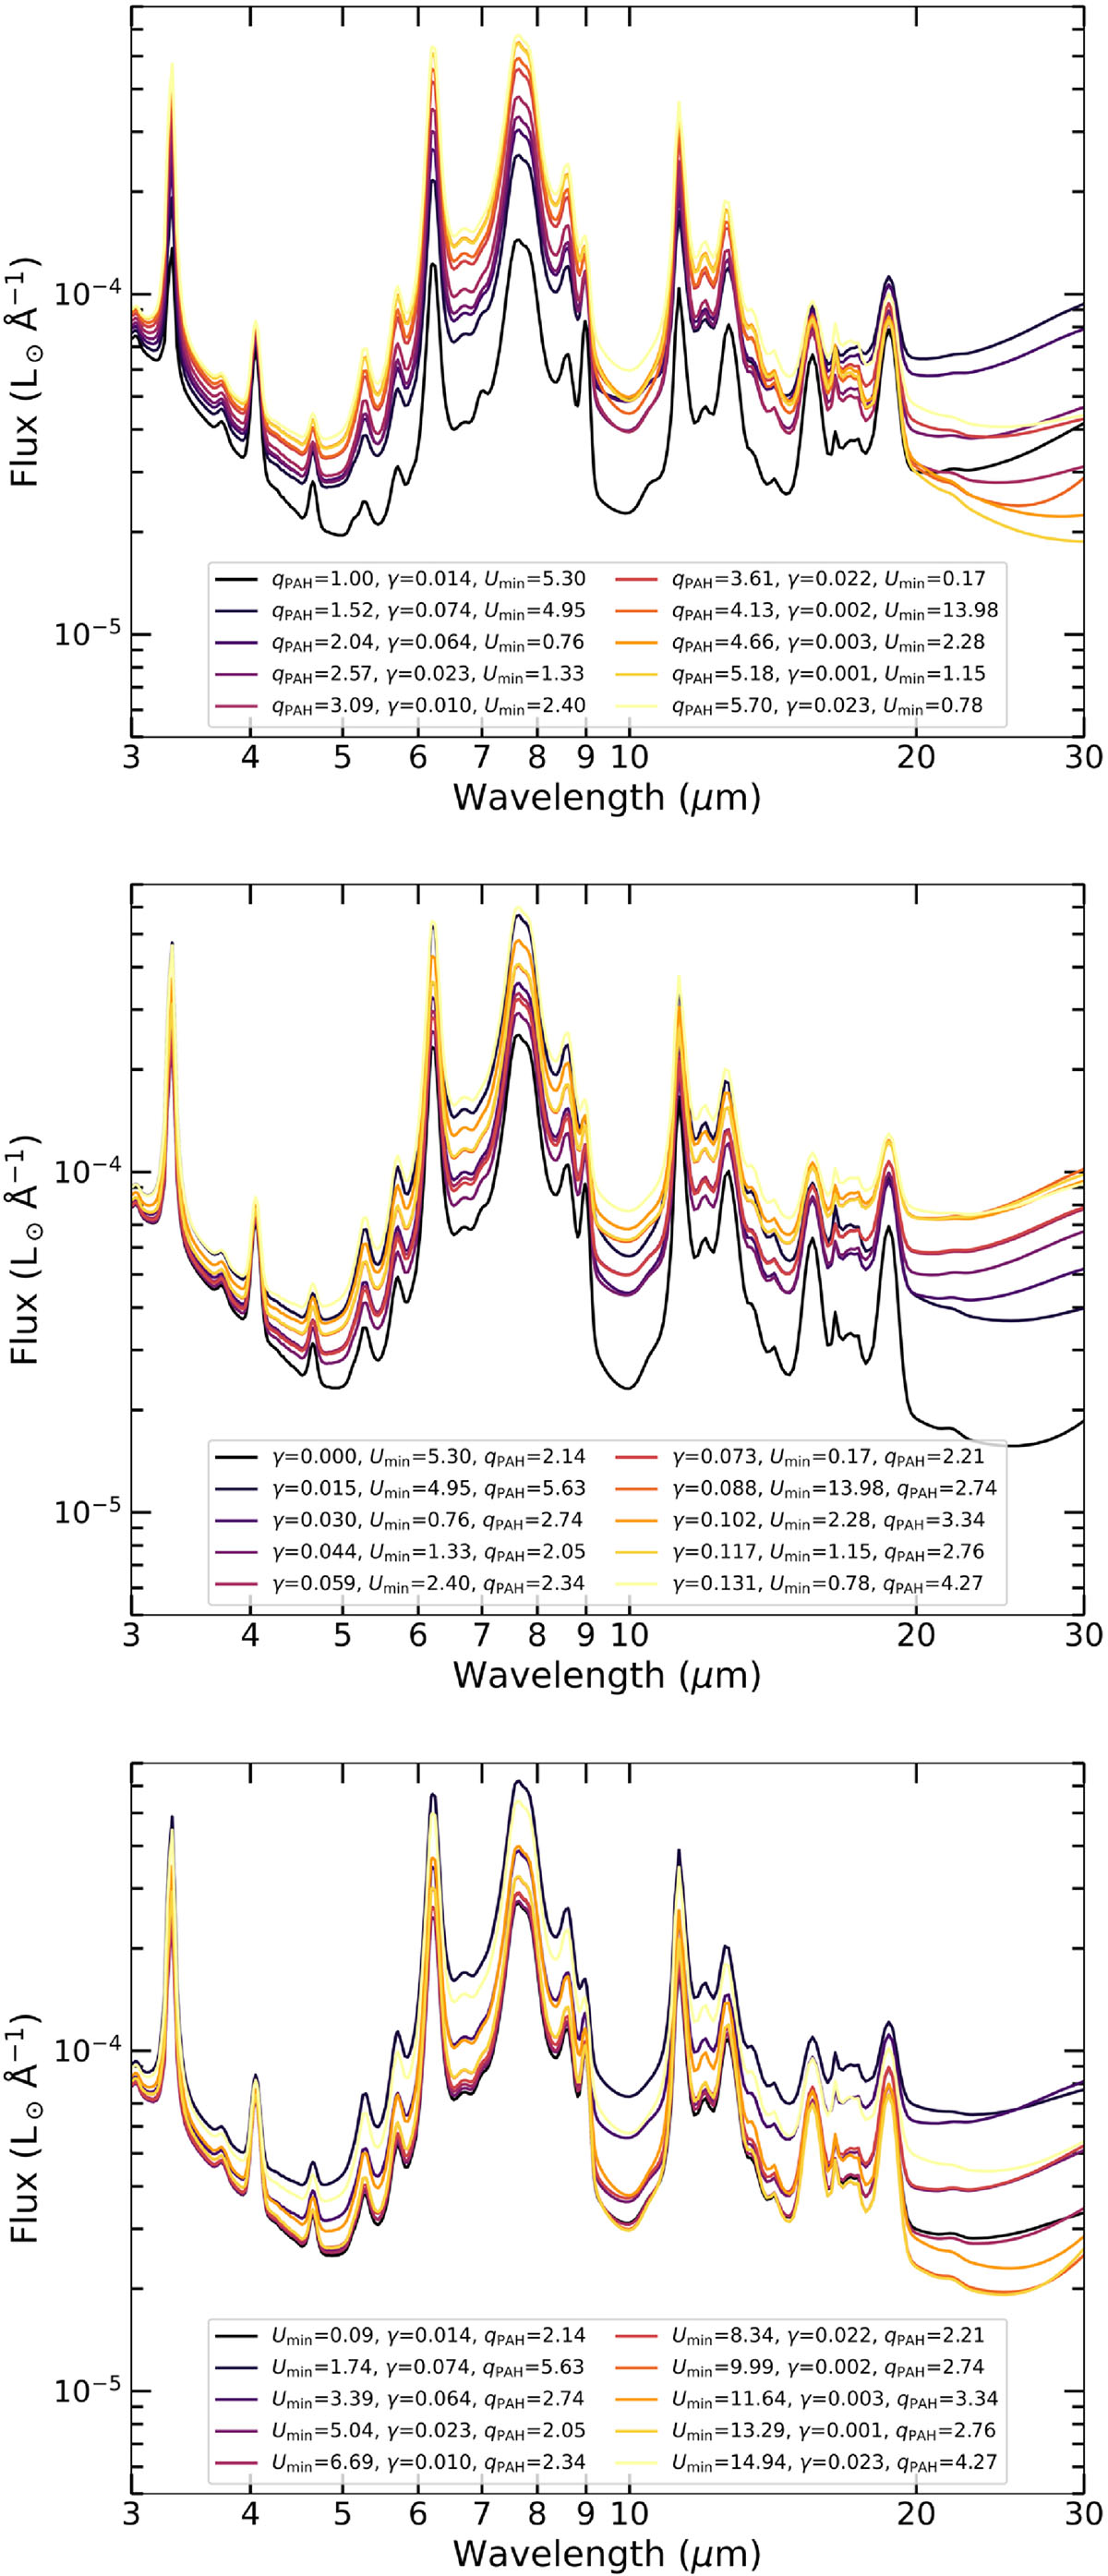
Fig. B.1.
Download original image
Synthetic mid-IR (3–30 μm) spectra demonstrating the influence of key dust parameters in the Draine et al. (2007) dust model. Each panel shows the variation of the spectrum by varying one parameter within its 95% confidence interval, while the rest are drawn independently from their assumed distributions. Top: Variation with the PAH mass fraction, qPAH. Middle: Variation with the fraction of dust mass exposed to high radiation fields, γ. Bottom: Variation with the minimum starlight intensity, Umin. We see that these three parameters have significant impact on the shape of the PAH spectrum when compared to that in Fig. B.2. All spectra have the same bolometric luminosity.
Current usage metrics show cumulative count of Article Views (full-text article views including HTML views, PDF and ePub downloads, according to the available data) and Abstracts Views on Vision4Press platform.
Data correspond to usage on the plateform after 2015. The current usage metrics is available 48-96 hours after online publication and is updated daily on week days.
Initial download of the metrics may take a while.