Fig. 2.
Download original image
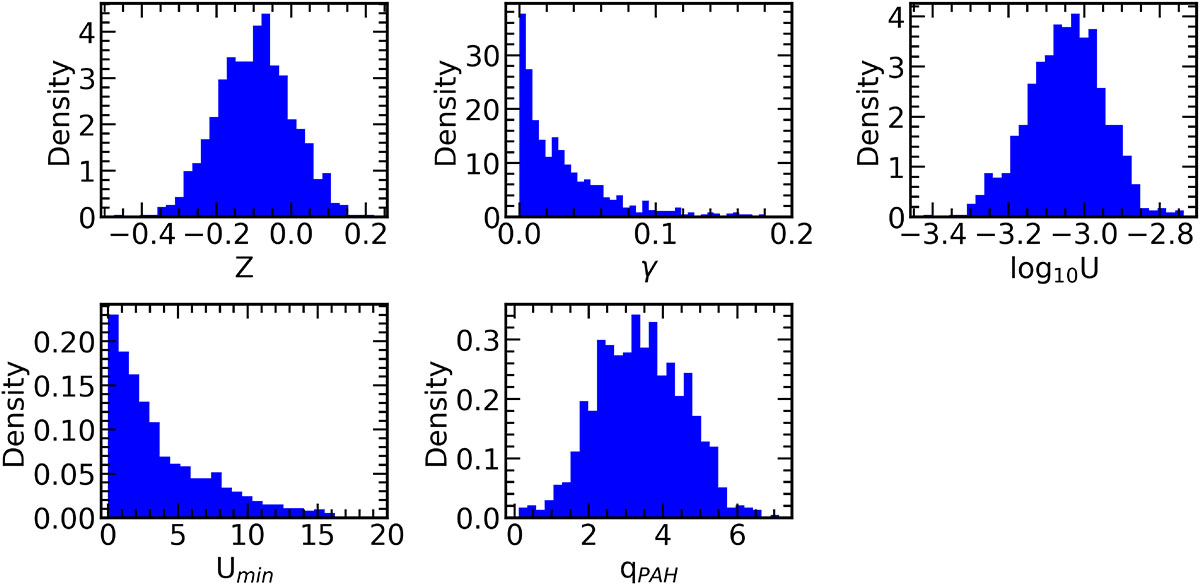
Histograms indicating the shapes and ranges of the distributions of the SPS parameters (Table 1) used as input to the FSPS to produce our mock sample of galaxies. In the top row, from left to right, we show the distribution densities of metallicity (Z), the dust fraction exposed to a high ionization field (γ), and the ionization parameter of the gas (log10U), respectively. On the bottom row on the left, we show the minimum (average) ionization field of the ISM (Umin), while on the bottom right we see the fraction of dust in the form of PAH molecules (qPAH). Each parameter set contains these five parameters drawn randomly and independently from each other based on the probability distributions shown above.
Current usage metrics show cumulative count of Article Views (full-text article views including HTML views, PDF and ePub downloads, according to the available data) and Abstracts Views on Vision4Press platform.
Data correspond to usage on the plateform after 2015. The current usage metrics is available 48-96 hours after online publication and is updated daily on week days.
Initial download of the metrics may take a while.