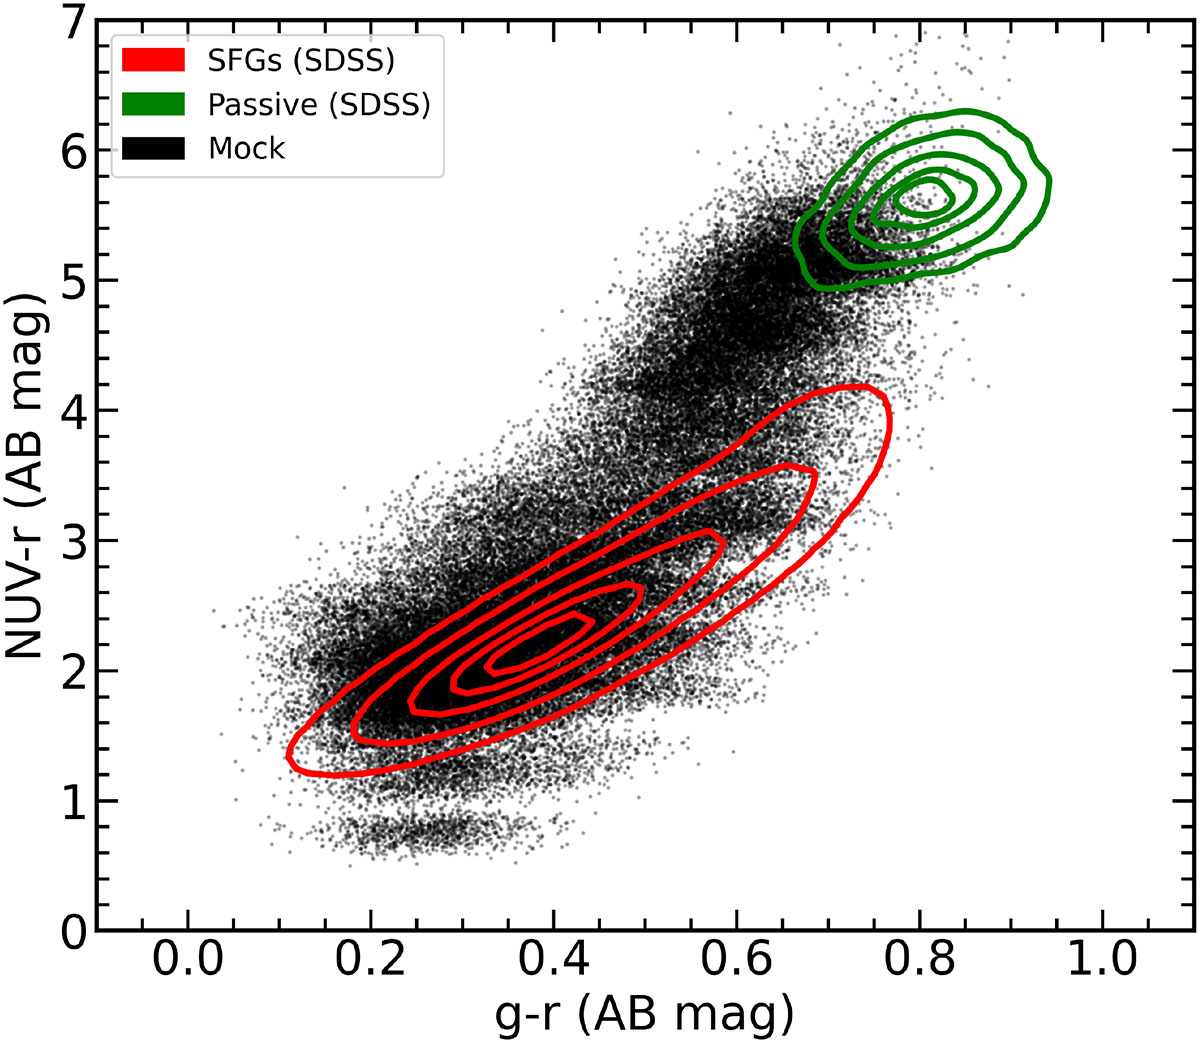
Fig. 3.
Download original image
Color–color diagram of NUV − r against g − r comparing the distributions of the mock (black dots) and a real SDSS (red contours) galaxy sample. We see general agreement between the two galaxy samples for almost the entire range of these colors especially for (g − r) ∼ 0.6. Photometric bands from GALEX (NUV) and the SDSS survey (g and r). We also show a sample of photometrically selected passive galaxies (green contours) for comparison. The mock data were artificially augmented with noise to achieve an S/N of 10 to match to the selection criteria for the SDSS and GALEX bands. Contour levels denote the 10th, 25th, 50th, 75th, and 90th percentiles for each population.
Current usage metrics show cumulative count of Article Views (full-text article views including HTML views, PDF and ePub downloads, according to the available data) and Abstracts Views on Vision4Press platform.
Data correspond to usage on the plateform after 2015. The current usage metrics is available 48-96 hours after online publication and is updated daily on week days.
Initial download of the metrics may take a while.