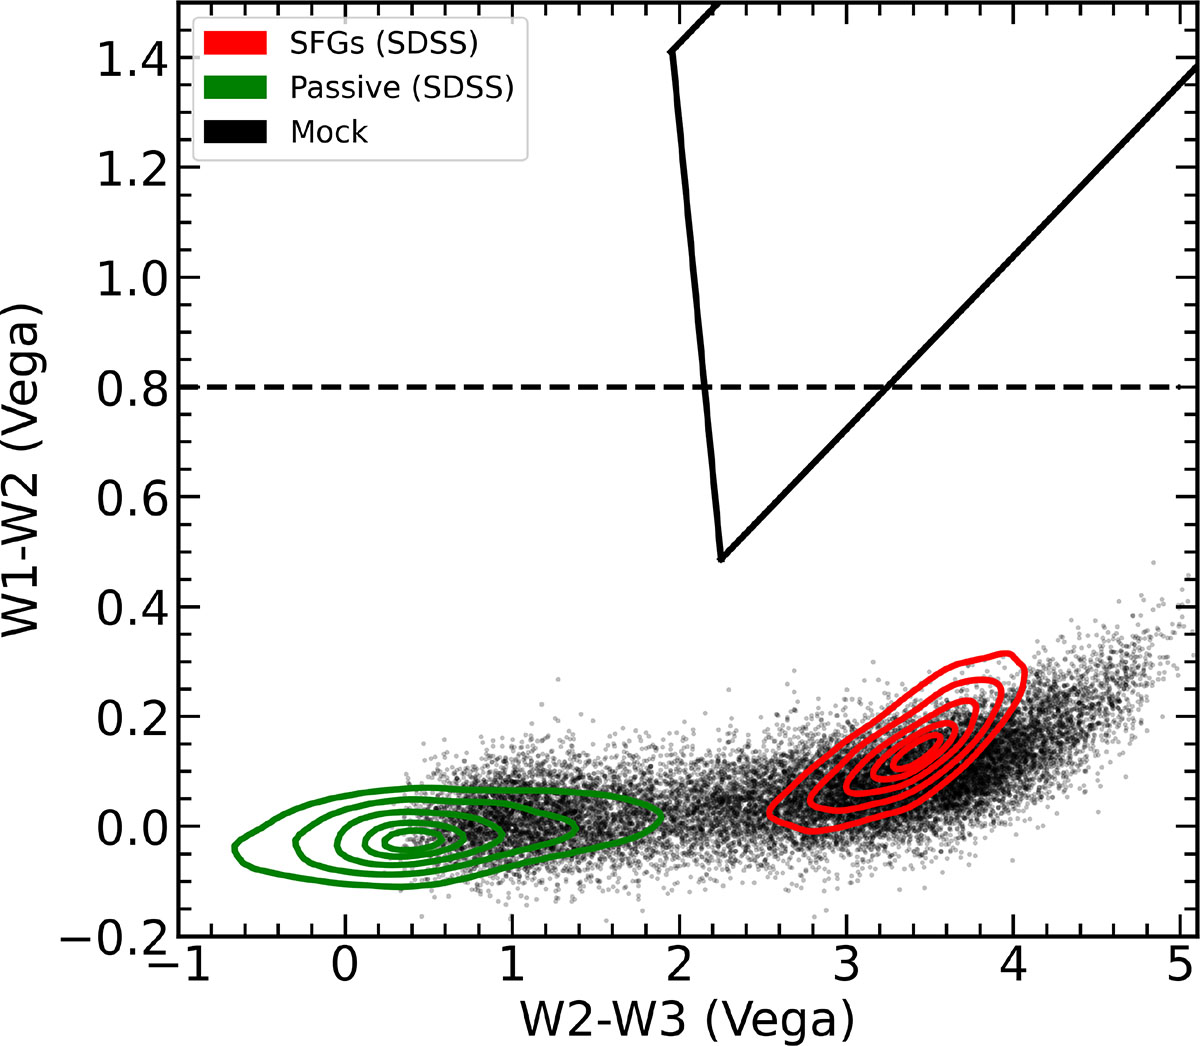
Fig. 5.
Download original image
Color–color diagram of W1 − W2 against W2 − W3 comparing the distributions of a mock (black dots) and a real star-forming galaxies from SDSS (red contours). We see very good agreement between the two galaxy samples. Also, both samples occupy the area well bellow the W1 − W2 = 0.8 (dashed black line) demarcation line defined by Stern et al. (2012) between the AGN and non-AGN galaxies and the AGN selection wedge (solid black lines) defined by Mateos et al. (2012). We also show a sample of photometrically selected passive galaxies (green contours) for comparison. Photometric bands from the WISE survey are shown. The mock data were artificially augmented with noise to achieve an S/N of 10 to match to the selection criteria for the WISE bands. Contour levels denote the 10th, 25th, 50th, 75th, and 90th percentiles for each population.
Current usage metrics show cumulative count of Article Views (full-text article views including HTML views, PDF and ePub downloads, according to the available data) and Abstracts Views on Vision4Press platform.
Data correspond to usage on the plateform after 2015. The current usage metrics is available 48-96 hours after online publication and is updated daily on week days.
Initial download of the metrics may take a while.