Fig. 6.
Download original image
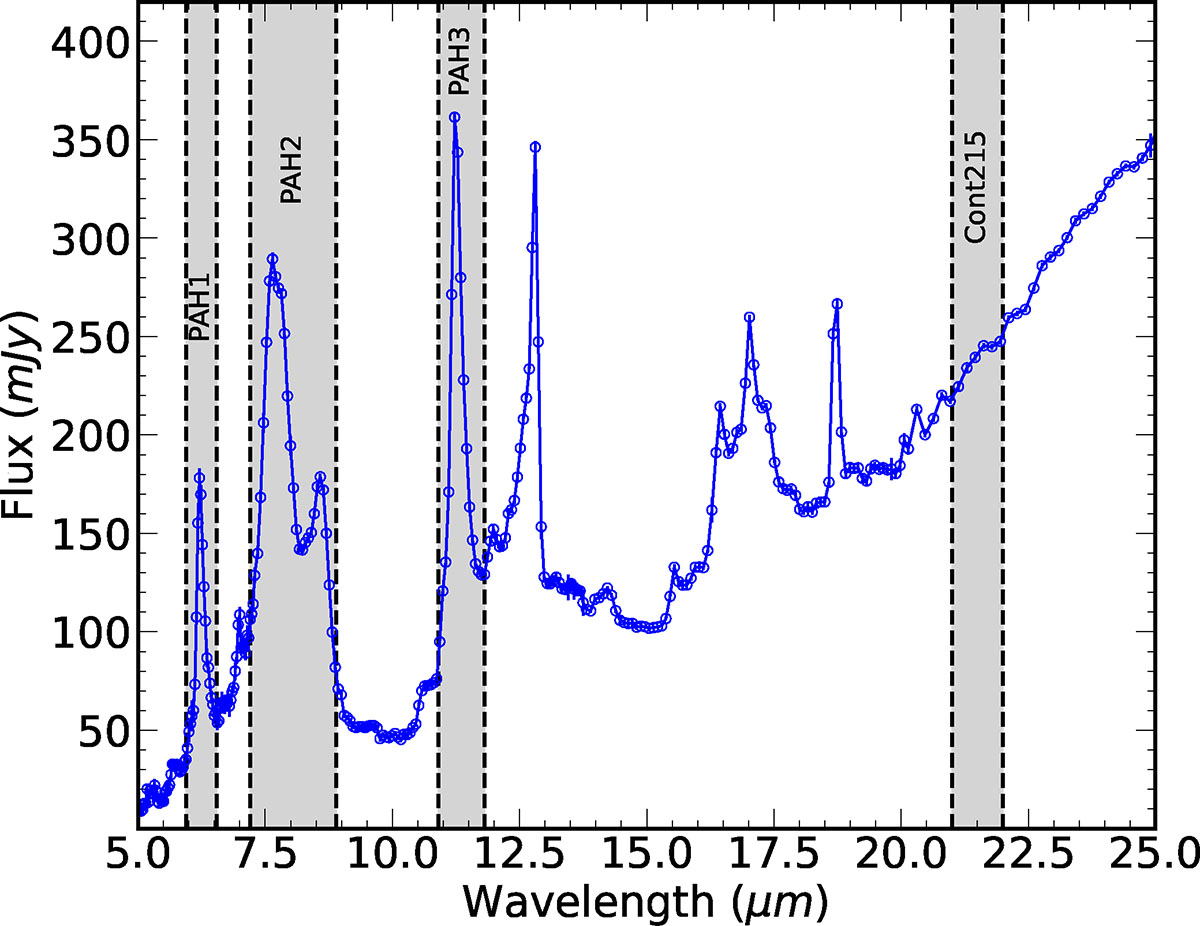
Mid-infrared (5–25 μm) spectrum of NGC 6120, observed with the IRS spectrograph aboard Spitzer, representing a typical star-forming galaxy (BPT class). In this spectrum, we mark the wavelength coverage of our four custom photometric bands, labeled in Table 2. The first three photometric bands (PAH1, PAH2, and PAH3) cover the strongest PAH emission features, while the last band (Cont215) covers a continuum region of the spectrum.
Current usage metrics show cumulative count of Article Views (full-text article views including HTML views, PDF and ePub downloads, according to the available data) and Abstracts Views on Vision4Press platform.
Data correspond to usage on the plateform after 2015. The current usage metrics is available 48-96 hours after online publication and is updated daily on week days.
Initial download of the metrics may take a while.