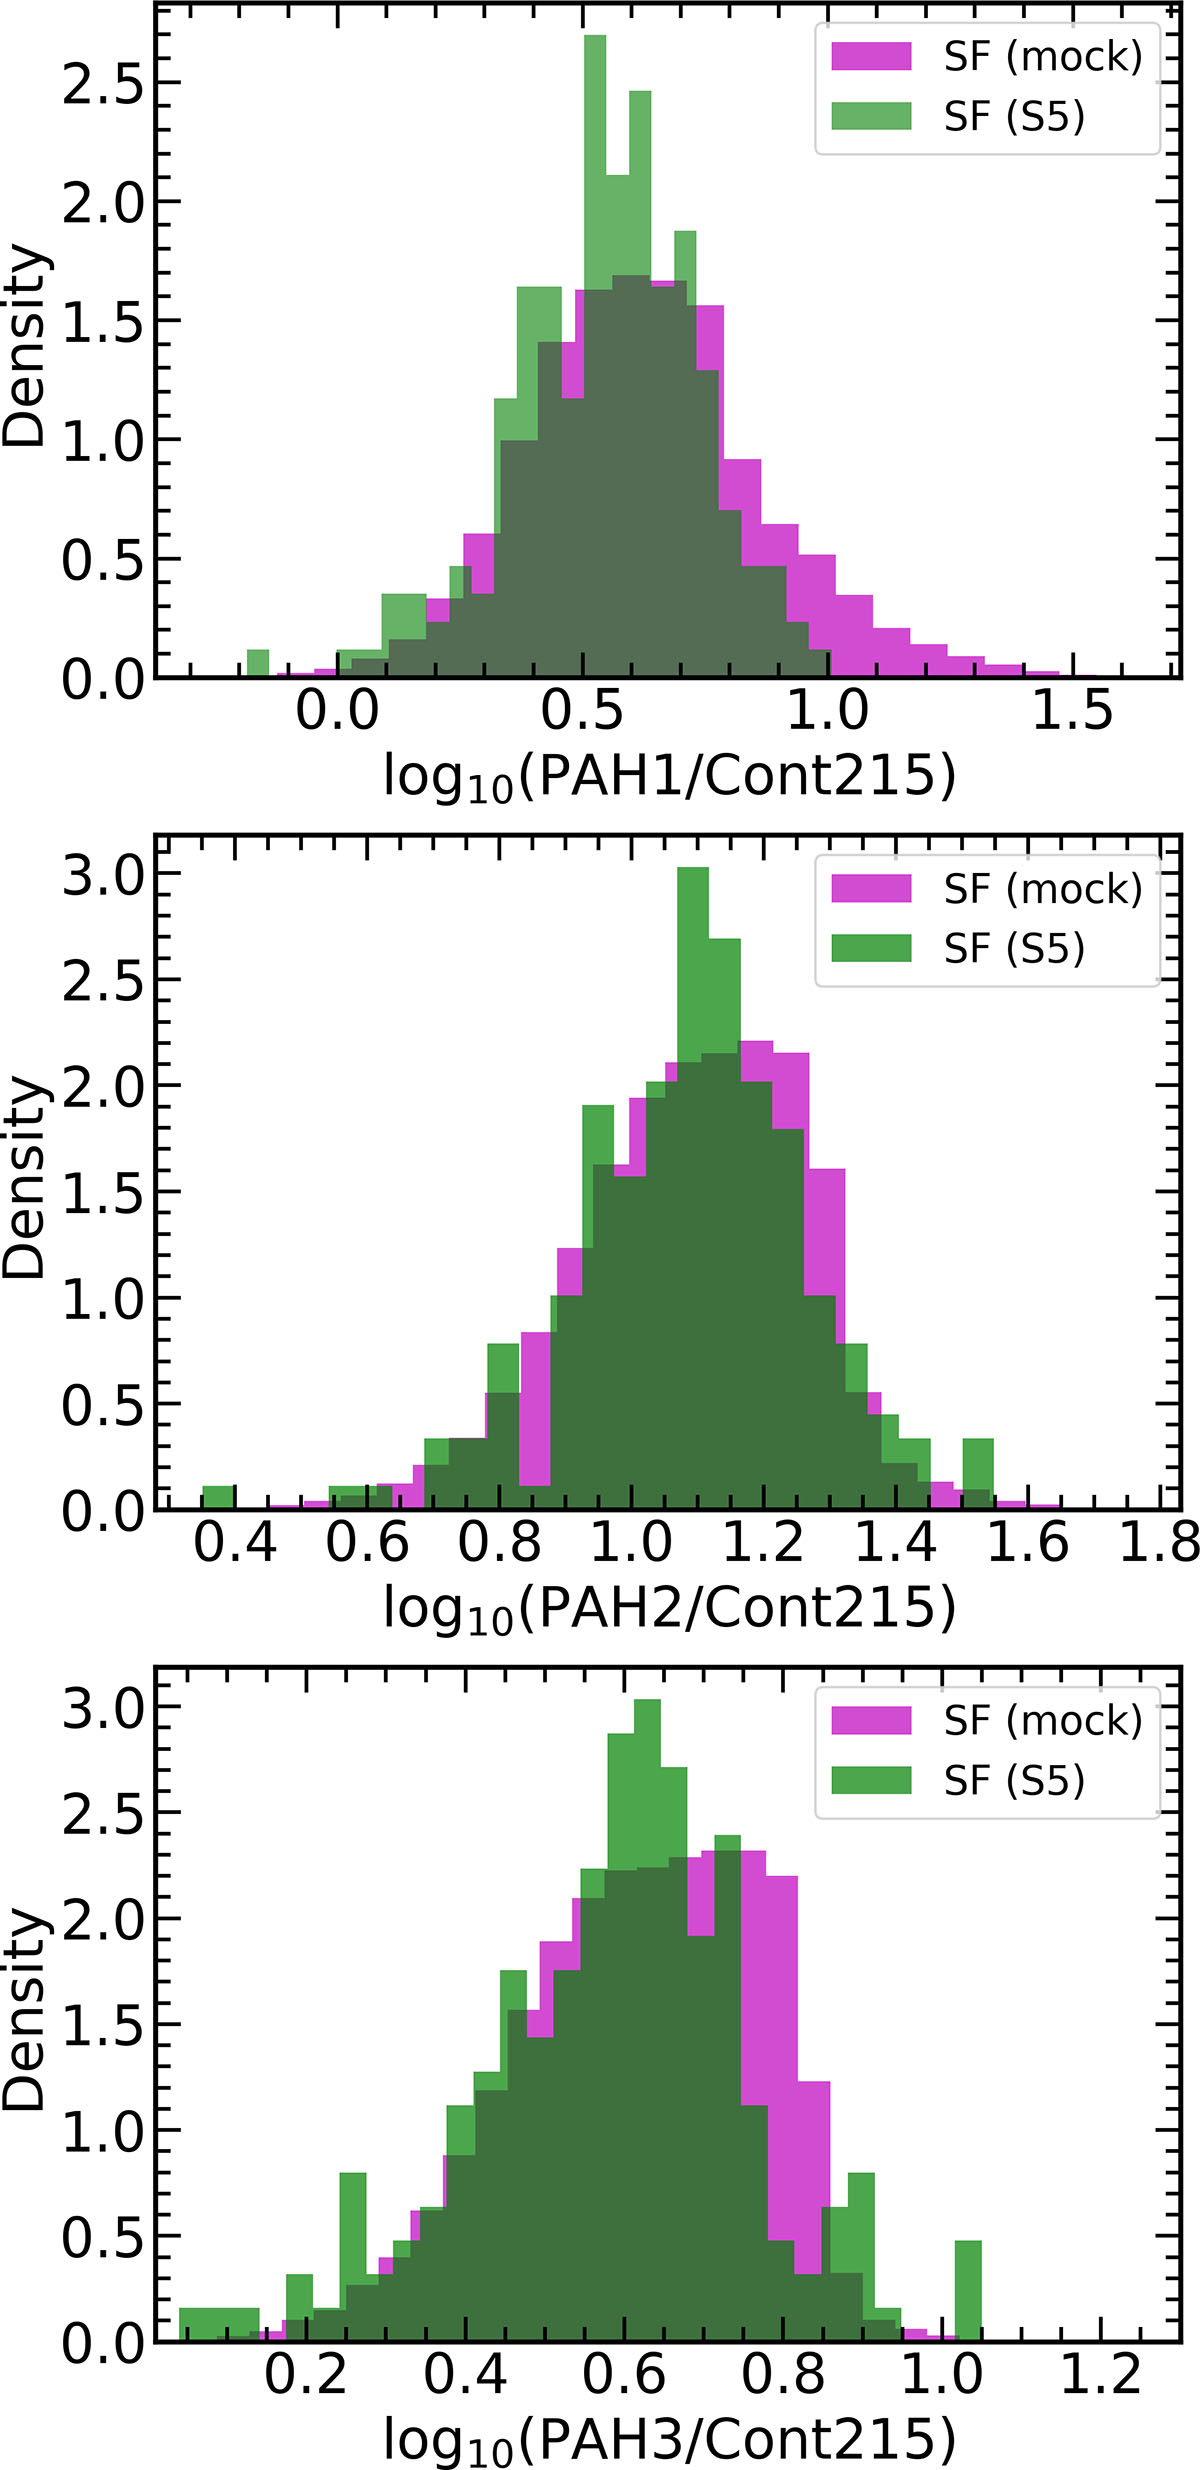
Fig. 7.
Download original image
Distributions of the three distinguishing features used to develop our diagnostic tool. From top to bottom: log10(PAH1/Cont215), log10(PAH2/Cont215), and log10(PAH3/Cont215), measured from both the S5 sample (green) of star-forming galaxies and our simulated sample of galaxies (purple). We find very good agreement between the two samples for all the features.
Current usage metrics show cumulative count of Article Views (full-text article views including HTML views, PDF and ePub downloads, according to the available data) and Abstracts Views on Vision4Press platform.
Data correspond to usage on the plateform after 2015. The current usage metrics is available 48-96 hours after online publication and is updated daily on week days.
Initial download of the metrics may take a while.