Fig. 1.
Download original image
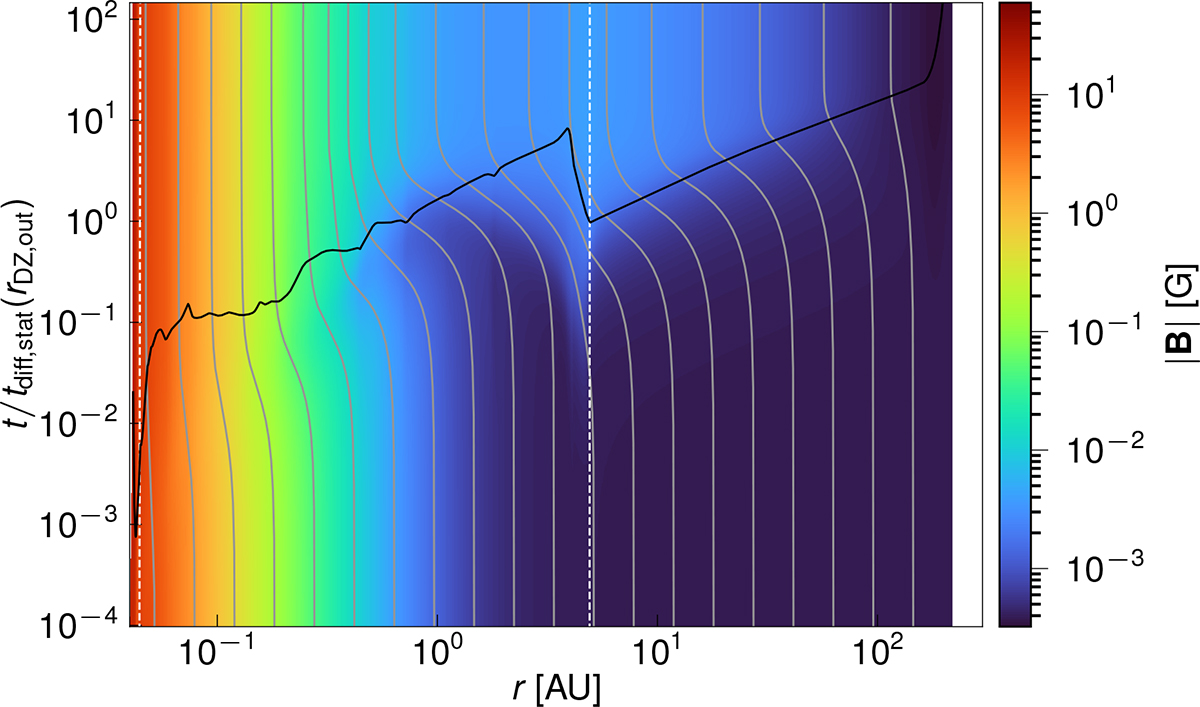
Time evolution of the magnetic field strength over time (normalised in units of the diffusion timescale of the stationary model at the outer DZ boundary, tdiff, stat(rDZ, out)), where the colour-coding represents the magnetic field strength, |B|, at every point in space and time. The gray lines show magnetic flux transport over time, using the effective, vertically averaged magnetic field transport velocity, ![]() . The dashed white lines denote the inner and outer boundary of the DZ, respectively, whereas the black full line denotes the diffusion timescale, tdiff, stat, of our stationary model. The inner DZ boundary is located very close to the inner disk rim.
. The dashed white lines denote the inner and outer boundary of the DZ, respectively, whereas the black full line denotes the diffusion timescale, tdiff, stat, of our stationary model. The inner DZ boundary is located very close to the inner disk rim.
Current usage metrics show cumulative count of Article Views (full-text article views including HTML views, PDF and ePub downloads, according to the available data) and Abstracts Views on Vision4Press platform.
Data correspond to usage on the plateform after 2015. The current usage metrics is available 48-96 hours after online publication and is updated daily on week days.
Initial download of the metrics may take a while.