Fig. 5.
Download original image
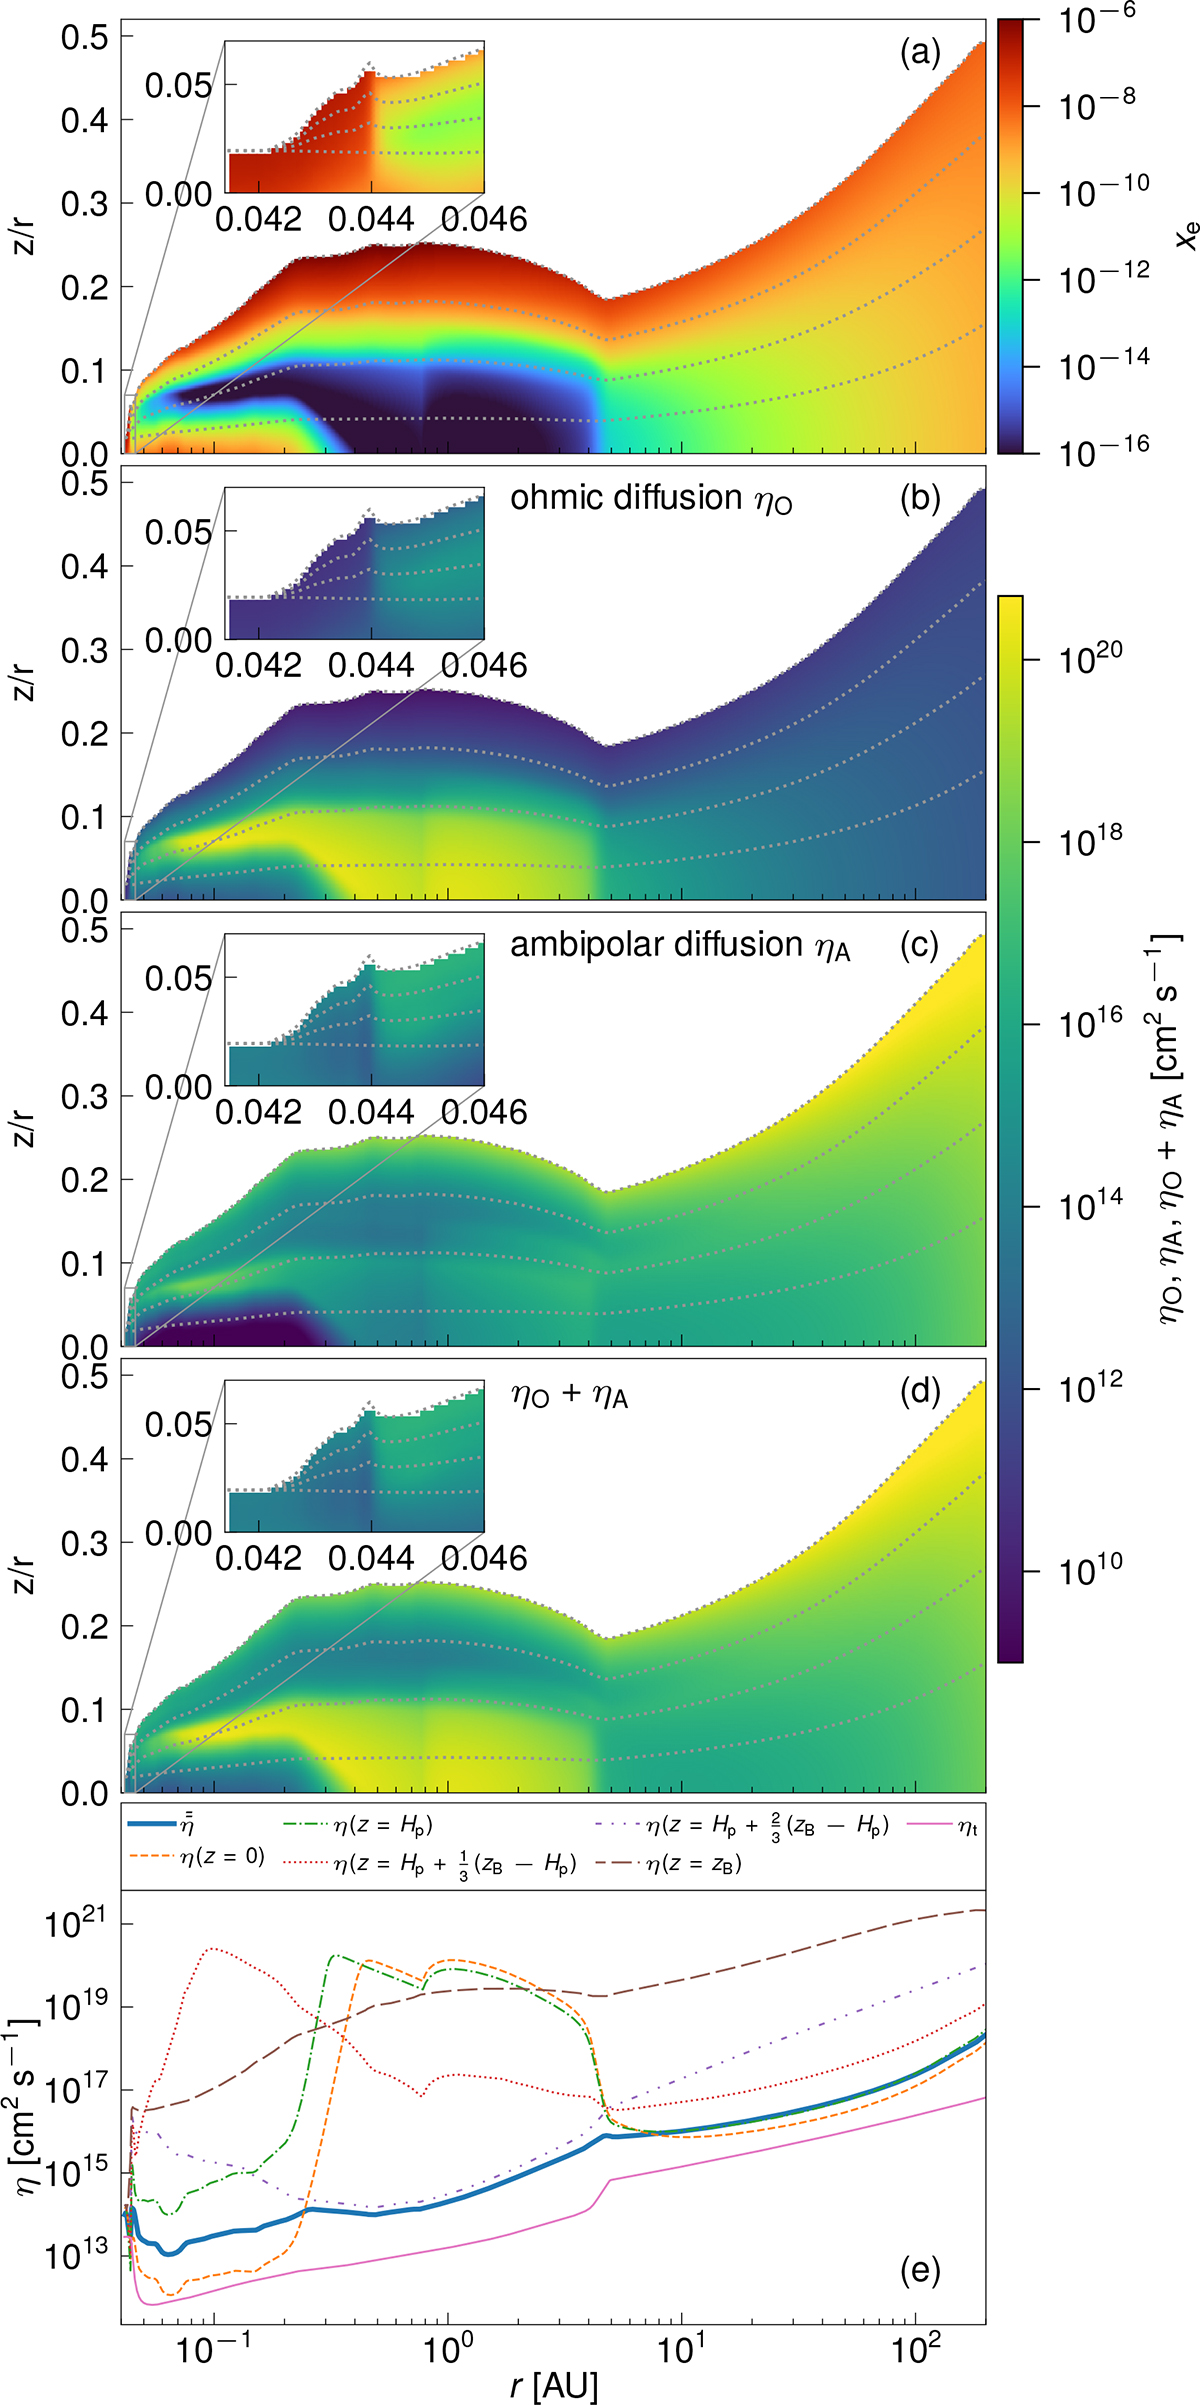
For better understanding of the regimes of thermal and non-thermal ionisation, the radial and vertical profiles of (a) ionisation fraction, xe; (b) the contribution of OD, ηO; (c) the contribution of AD, ηA; and (d) the combined resistivity, η(r, z) = ηO(r, z)+ηA(r, z), are plotted for our reference model, which is explained in Sect. 3.1 (cf. Table 2). The dashed gray lines in (a)–(d) correspond to specific heights above the disk midplane (z = 0, z = Hp, ![]() ,
, ![]() , and z = zB). In (e) the combined resistivity is plotted for those specific heights, as well as the resulting vertically averaged resistivity
, and z = zB). In (e) the combined resistivity is plotted for those specific heights, as well as the resulting vertically averaged resistivity ![]() (thick blue line). For comparison the turbulent resistivity, ηt, corresponding to a Prandtl number of 1 is also plotted, showing that
(thick blue line). For comparison the turbulent resistivity, ηt, corresponding to a Prandtl number of 1 is also plotted, showing that ![]() almost everywhere except for the very inner region.
almost everywhere except for the very inner region.
Current usage metrics show cumulative count of Article Views (full-text article views including HTML views, PDF and ePub downloads, according to the available data) and Abstracts Views on Vision4Press platform.
Data correspond to usage on the plateform after 2015. The current usage metrics is available 48-96 hours after online publication and is updated daily on week days.
Initial download of the metrics may take a while.