Fig. 7.
Download original image
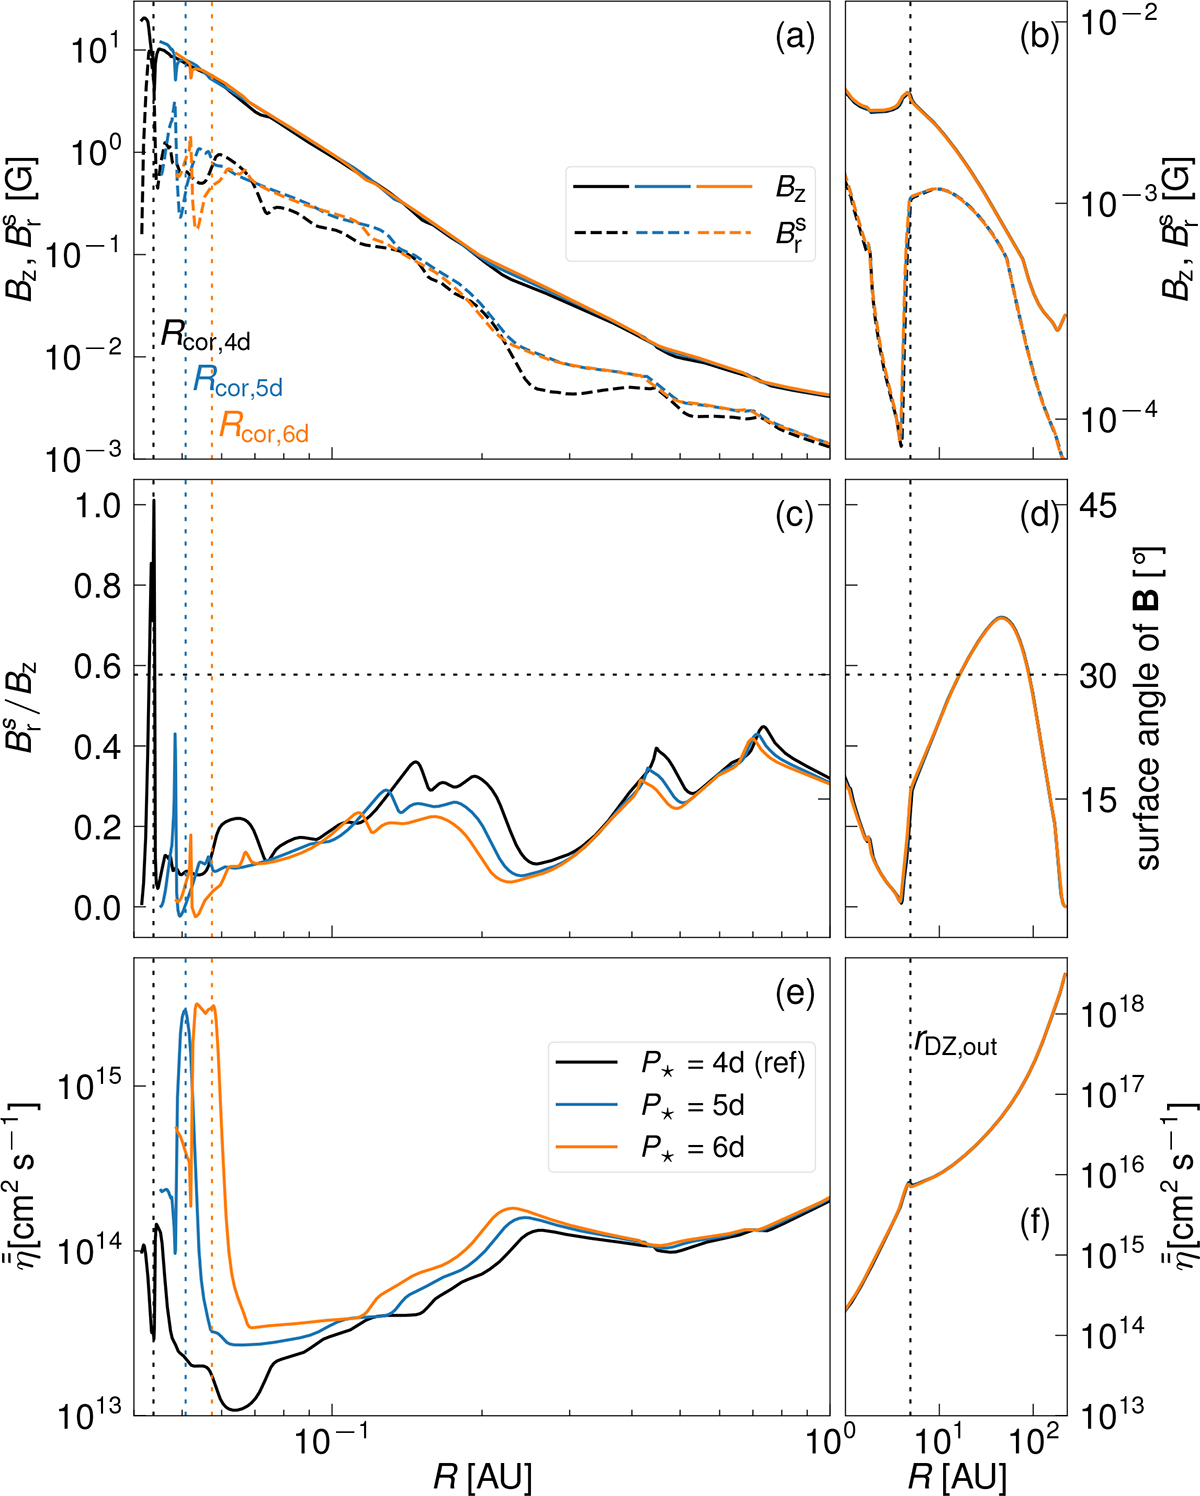
Comparison of the magnetic field topology between our reference model (P⋆ = 4 days, black) and two stars with P⋆ = 5 days (blue) and P⋆ = 6 days (orange). The vertical dashed lines mark the positions of Rcor and are colour-coded accordingly. Panels (a) and (b) show the vertical and radial magnetic field profiles in the inner and outer disk, respectively. Panels (c) and (d) depict the conductivity-weighted, vertically averaged resistivity ![]() , whereas panels (e) and (f) describe the ratio Brs/Bz. The scale on the right-hand side of (c) and (d) denotes the angle of the magnetic field lines to the midplane normal, which corresponds to tan−1(Brs/Bz). The dashed horizontal line marks a surface angle of 30°, which is an indicator for efficient MHD winds (see text).
, whereas panels (e) and (f) describe the ratio Brs/Bz. The scale on the right-hand side of (c) and (d) denotes the angle of the magnetic field lines to the midplane normal, which corresponds to tan−1(Brs/Bz). The dashed horizontal line marks a surface angle of 30°, which is an indicator for efficient MHD winds (see text).
Current usage metrics show cumulative count of Article Views (full-text article views including HTML views, PDF and ePub downloads, according to the available data) and Abstracts Views on Vision4Press platform.
Data correspond to usage on the plateform after 2015. The current usage metrics is available 48-96 hours after online publication and is updated daily on week days.
Initial download of the metrics may take a while.