Fig. 10.
Download original image
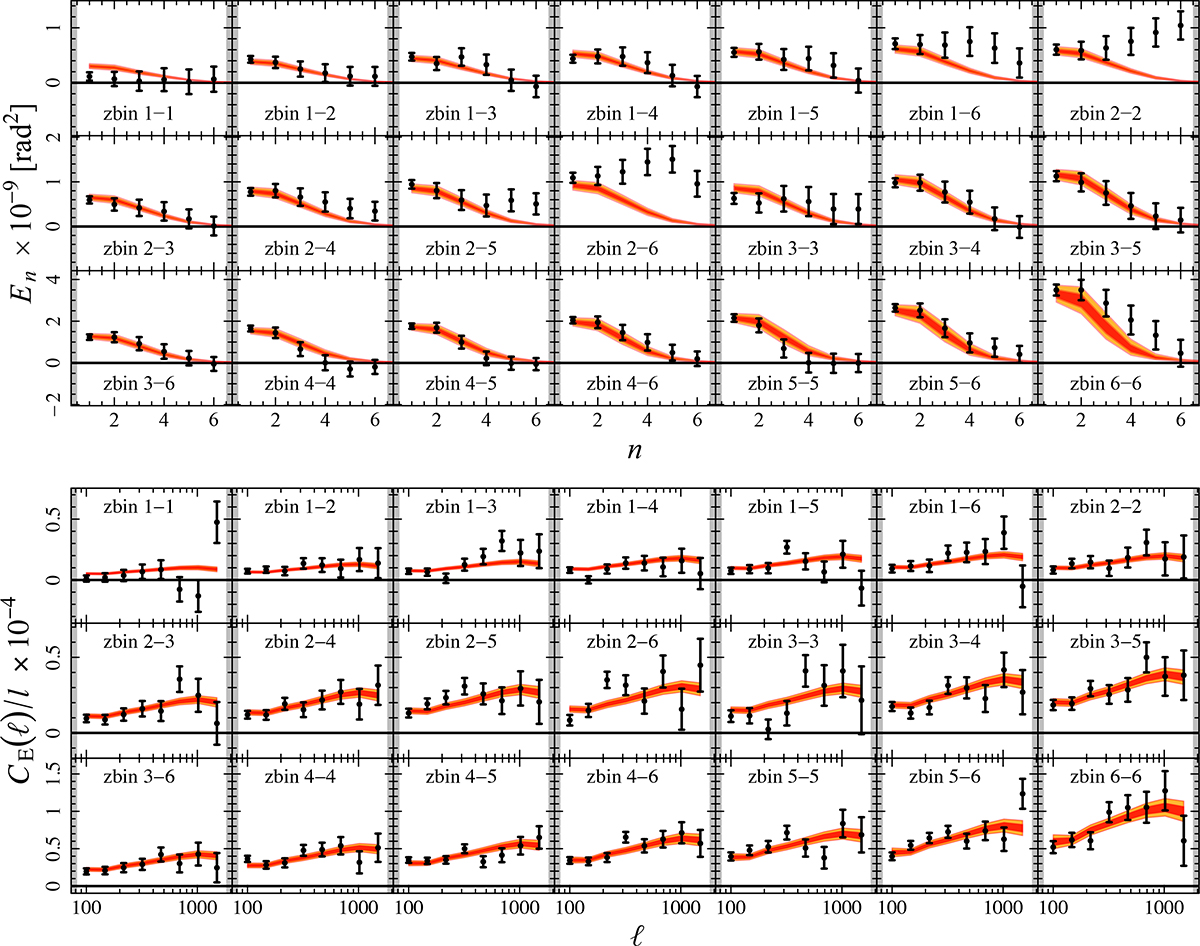
Data vector and TPDs for the fiducial analysis of En (upper panel) and CE (lower panel). TPDs are shown as polygons spanning the 68th (red), and 95th (orange) percentiles of the posterior models. The En signals are highly correlated across modes within a tomographic bin, so readers are cautioned against so-called ‘χ-by-eye’. The bin 2 autocorrelation signal, for example, is consistent with the best fit model (PTE = 0.09), despite the apparent divergence of the data from the model. The overall PTEs for the full tomographic dataset in each statistic are provided in Table 4.
Current usage metrics show cumulative count of Article Views (full-text article views including HTML views, PDF and ePub downloads, according to the available data) and Abstracts Views on Vision4Press platform.
Data correspond to usage on the plateform after 2015. The current usage metrics is available 48-96 hours after online publication and is updated daily on week days.
Initial download of the metrics may take a while.