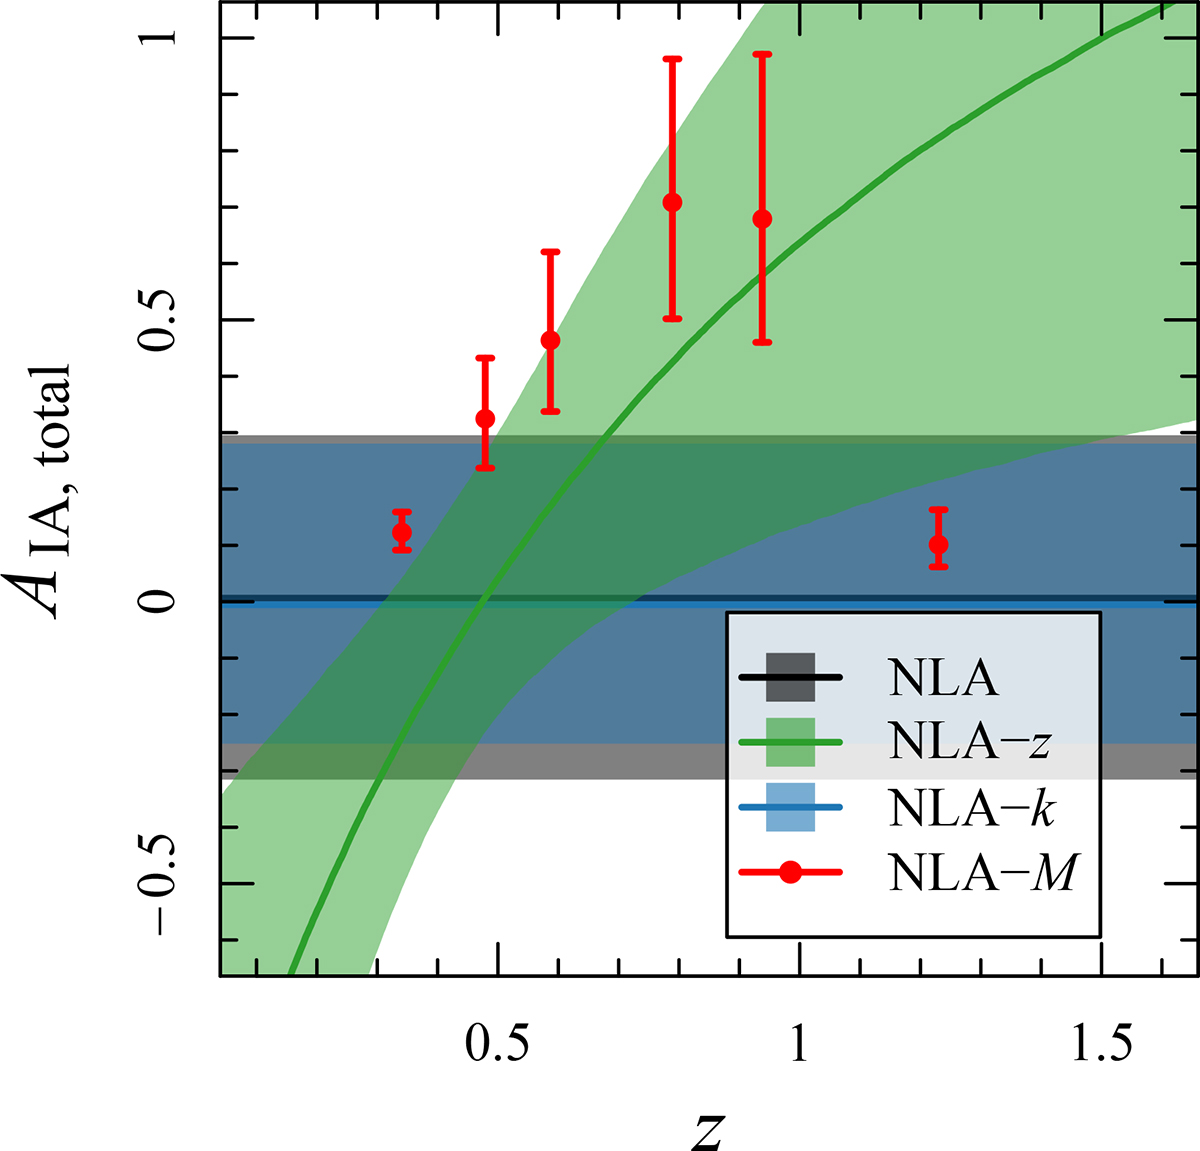
Fig. 12.
Download original image
Constraints on the total intrinsic alignment amplitude from the various intrinsic alignment models, per tomographic bin (where appropriate), computed using the En posteriors. Bands and error bars represent the 1σ posterior constraint on each model. Our NLA-M model (red) is shown per tomographic bin, with the point positioned at the mean photo-z of the bin.
Current usage metrics show cumulative count of Article Views (full-text article views including HTML views, PDF and ePub downloads, according to the available data) and Abstracts Views on Vision4Press platform.
Data correspond to usage on the plateform after 2015. The current usage metrics is available 48-96 hours after online publication and is updated daily on week days.
Initial download of the metrics may take a while.