Fig. 8.
Download original image
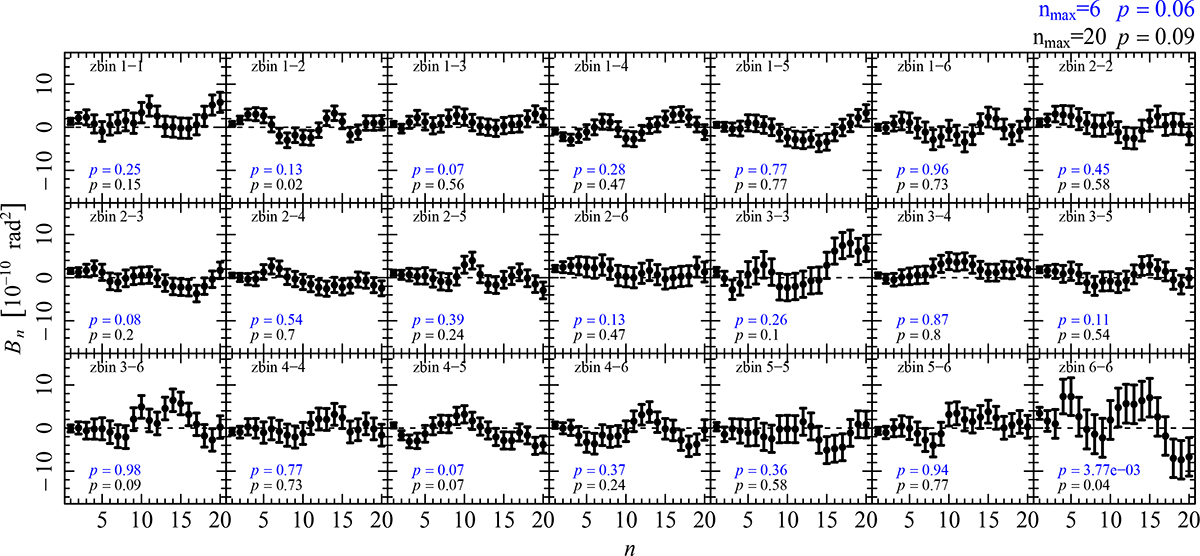
COSEBIs B modes measured in KiDS-Legacy. Each panel is annotated with the p-value of the B-mode signals for twenty modes (black) and our fiducial 6 modes (blue). The total p-value for the full data vector, also for six and twenty modes, is annotated in the upper right corner of the figure. The B-mode signals are highly correlated across modes within a tomographic bin, so readers are cautioned against so-called ‘χ-by-eye’.
Current usage metrics show cumulative count of Article Views (full-text article views including HTML views, PDF and ePub downloads, according to the available data) and Abstracts Views on Vision4Press platform.
Data correspond to usage on the plateform after 2015. The current usage metrics is available 48-96 hours after online publication and is updated daily on week days.
Initial download of the metrics may take a while.