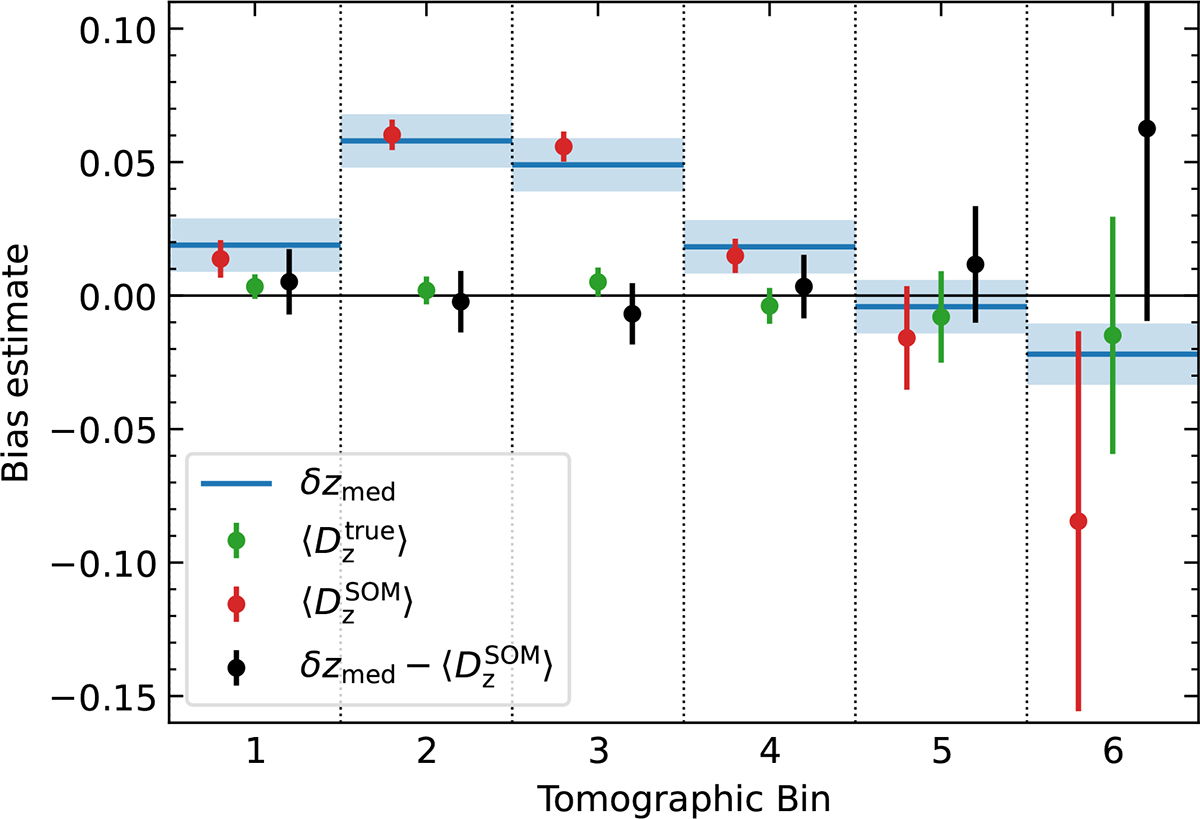
Fig. 11.
Download original image
Mean and scatter of the shift parameters obtained from the 100 MICE2 realisations with noise adaptation. The blue line and shaded area indicate the bias in the median SOM redshift, the green and red data points indicate the mean and scatter of the shift-fit parameters Dz when fitting the realisations with either the true or SOM redshift distribution. The black data points represent the difference between the empirical SOM bias estimate and the shift-fit parameter.
Current usage metrics show cumulative count of Article Views (full-text article views including HTML views, PDF and ePub downloads, according to the available data) and Abstracts Views on Vision4Press platform.
Data correspond to usage on the plateform after 2015. The current usage metrics is available 48-96 hours after online publication and is updated daily on week days.
Initial download of the metrics may take a while.