Fig. A.1.
Download original image
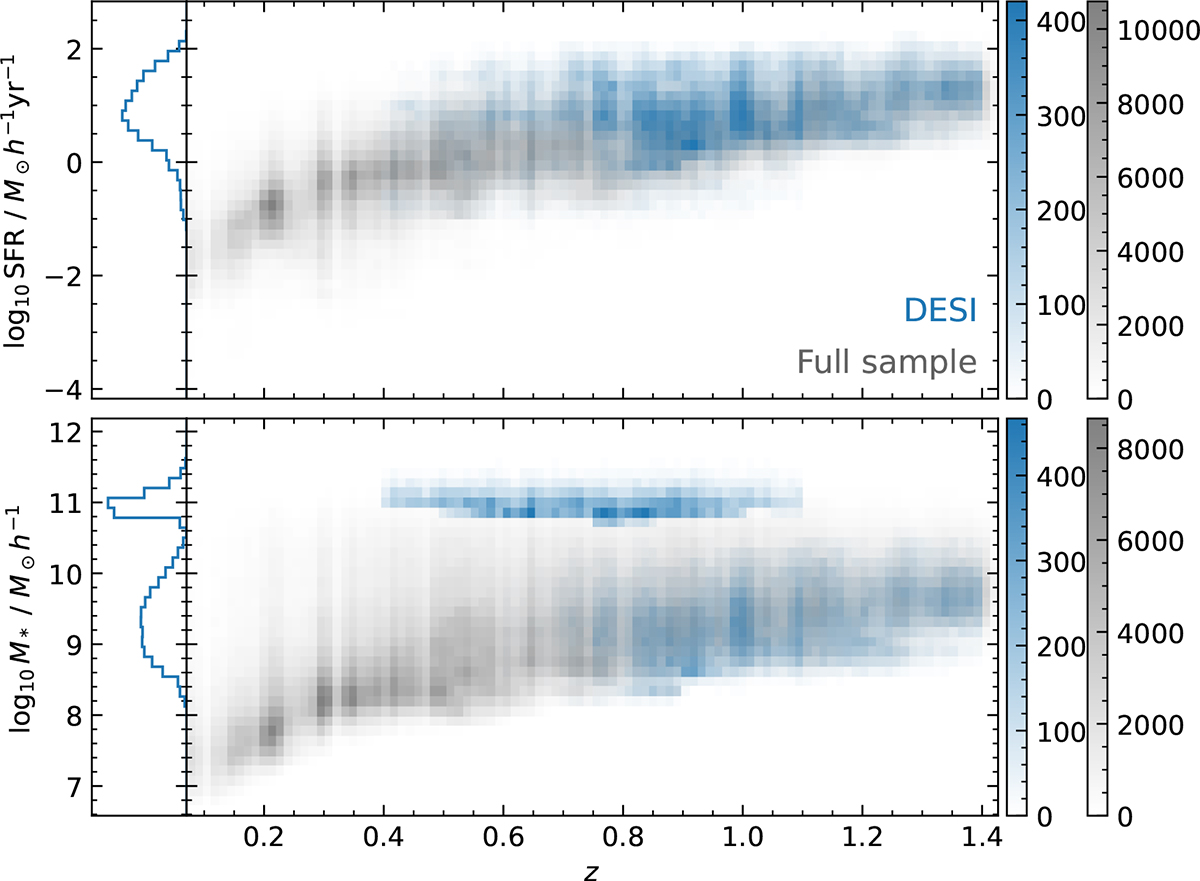
Comparison of the star-formation rate (top) and the stellar mass (bottom) for the full MICE simulation (grey) and our simulated DESI LRG and ELG samples (blue) as a function of redshift. The data is selected from a 44 deg2 patch of MICE2. The lower panel clearly shows the separation of the ELG from the LRG sample, which is selected based on stellar mass.
Current usage metrics show cumulative count of Article Views (full-text article views including HTML views, PDF and ePub downloads, according to the available data) and Abstracts Views on Vision4Press platform.
Data correspond to usage on the plateform after 2015. The current usage metrics is available 48-96 hours after online publication and is updated daily on week days.
Initial download of the metrics may take a while.