Open Access
Fig. 7.
Download original image
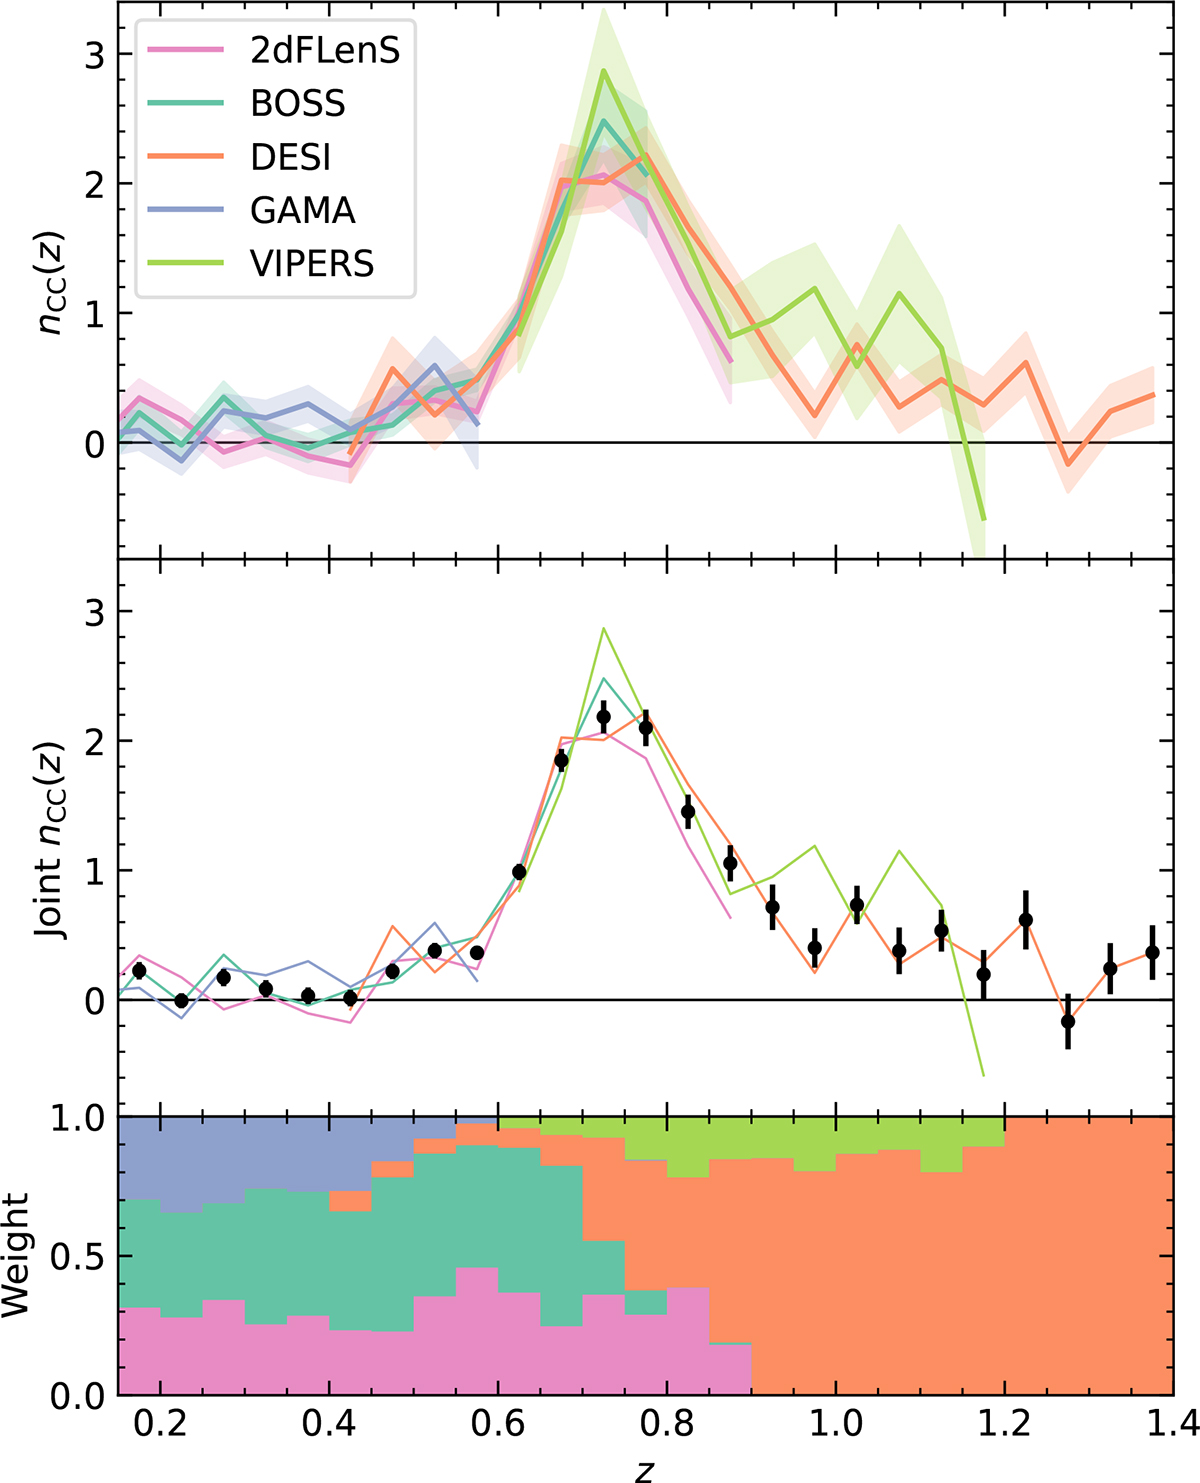
Example of the inverse-variance weighted combination of CCs computed from the fourth tomographic bin of MICE2. The top panel shows the individual measurements from each calibration sample, the middle panel the weighted average, and the bottom panel the relative weight of each sample as a function of redshift.
Current usage metrics show cumulative count of Article Views (full-text article views including HTML views, PDF and ePub downloads, according to the available data) and Abstracts Views on Vision4Press platform.
Data correspond to usage on the plateform after 2015. The current usage metrics is available 48-96 hours after online publication and is updated daily on week days.
Initial download of the metrics may take a while.