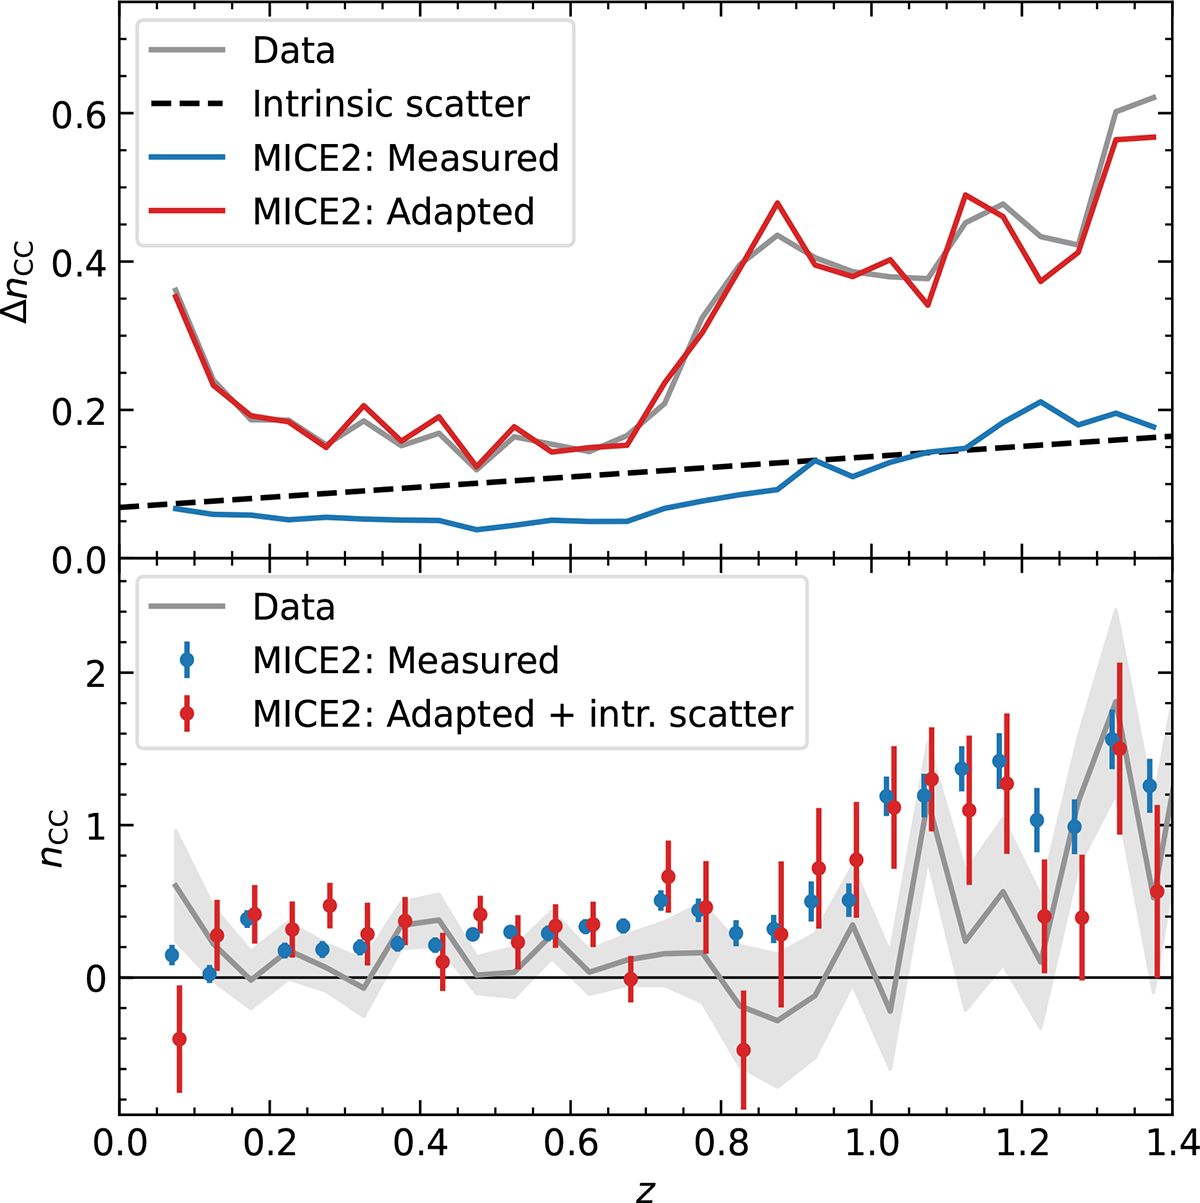
Fig. 8.
Download original image
One realisation of the CC measurements from MICE2 in the sixth tomographic bin after noise adaptation (Sect. 5.3) and the addition of intrinsic scatter (Sect 5.4). The top panel compares only the uncertainties of NCC(z) from the data (grey) and MICE2 before (blue) and after adaptation (red). The dashed black line indicates the fitted intrinsic scatter from the measurements on the data (f = 0.14 ± 0.04; see Eq. 6). The bottom panel shows the measured NCC(z) from MICE2 (blue points) compared to the data (grey line). The red data points represent the MICE2 measurements after adapting the noise (up-scaling errors and perturbing values) and adding the intrinsic scatter (only perturbing valu-es) obtained from the data.
Current usage metrics show cumulative count of Article Views (full-text article views including HTML views, PDF and ePub downloads, according to the available data) and Abstracts Views on Vision4Press platform.
Data correspond to usage on the plateform after 2015. The current usage metrics is available 48-96 hours after online publication and is updated daily on week days.
Initial download of the metrics may take a while.