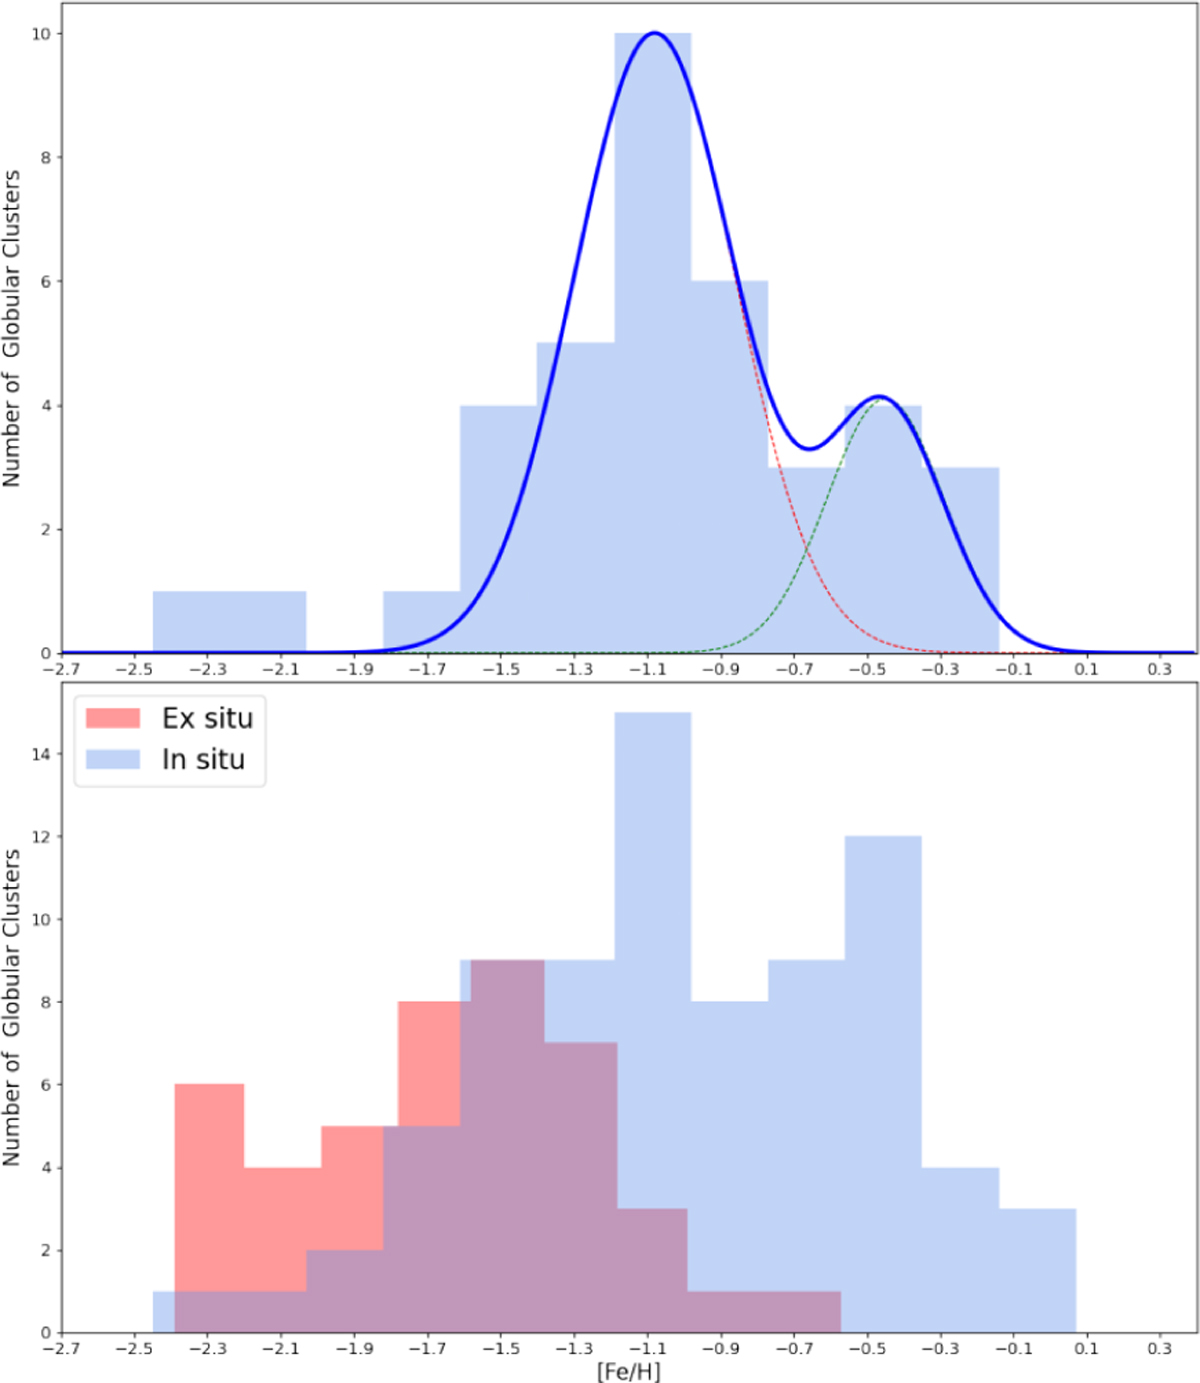
Fig. 7
Download original image
Top: metallicity distribution (MD) for our BGC sample. The raw histogram and a smoothed fit are shown in blue, while a bimodal gaussian fit is indicated in red and green dashed curves. The BGC MD is strongly bimodal and dominated by the metal-poor peak. Bottom: MD for our in situ versus ex situ cluster samples. The in situ sample retains the bimodality displayed by the BGCs alone, while the ex situ MD is mainly unimodal. Both populations have clusters extending to the lowest metallicities, while essentially only the in situ sample has metal-rich clusters.
Current usage metrics show cumulative count of Article Views (full-text article views including HTML views, PDF and ePub downloads, according to the available data) and Abstracts Views on Vision4Press platform.
Data correspond to usage on the plateform after 2015. The current usage metrics is available 48-96 hours after online publication and is updated daily on week days.
Initial download of the metrics may take a while.