| Issue |
A&A
Volume 703, November 2025
|
|
|---|---|---|
| Article Number | A267 | |
| Number of page(s) | 21 | |
| Section | Galactic structure, stellar clusters and populations | |
| DOI | https://doi.org/10.1051/0004-6361/202554923 | |
| Published online | 24 November 2025 | |
CAPOS: The bulge Cluster APOgee Survey
VIII. Final ASPCAP results for all clusters
1
Departamento de Astronomía, Casilla 160-C, Universidad de Concepción,
Concepción,
Chile
2
Departamento de Astronomía, Facultad de Ciencias, Universidad de La Serena.
Av. Raul Bitran 1305,
La Serena,
Chile
3
Universidad Andres Bello, Facultad de Ciencias Exactas, Departamento de Ciencias Físicas – Instituto de Astrofisica,
Autopista Concepcion-Talcahuano 7100,
Talcahuano,
Chile
4
Deptartment of Physics and Astronomy, Rutgers the State University of New Jersey,
136 Frelinghuysen Road.,
Piscataway,
NJ
08854,
USA
5
Instituto de Astrofísica, Depto. de Física y Astronomía, Facultad de Ciencias Exactas, Universidad Andres Bello,
Av. Fernandez Concha 700,
Santiago,
Chile
6
Vatican Observatory,
V00120
Vatican City State,
Italy
7
Department of Astronomy, University of Virginia,
Charlottesville,
VA
22904-4325,
USA
8
Saint Martin’s University,
5000 Abbey Way SE,
Lacey,
WA
98503,
USA
9
Universidade de São Paulo, IAG, Rua do Matão 1226, Cidade Universitária,
São Paulo
05508-900,
Brazil
10
Steward Observatory, The University of Arizona,
933 North Cherry Avenue,
Tucson,
AZ
85721-0065,
USA
11
Observatório Nacional,
Rua General José Cristino, 77,
20921-400
Sao Cristóvao, Rio de Janeiro,
RJ,
Brazil
12
National Optical Astronomy Observatory,
950 North Cherry Avenue,
Tucson,
AZ
85719,
USA
13
Vicerrectoría de Investigación y Postgrado, Universidad de La Serena,
La Serena
170000,
Chile
★ Corresponding author: This email address is being protected from spambots. You need JavaScript enabled to view it.
Received:
1
April
2025
Accepted:
12
August
2025
Abstract
Context. Bulge globular clusters (BGCs) are exceptional tracers of the formation and chemodynamical evolution of this oldest Galactic component. Until now, observational difficulties have prevented us from taking full advantage of these powerful Galactic archeological tools.
Aims. The bulge Cluster APOgee Survey (CAPOS) addresses this key topic by observing a large number of BGCs, most of which have been poorly studied until now. We aim to obtain accurate mean values for metallicity, [α/Fe], and radial velocity, as well as abundances for eleven other elements. Here, we present final parameters based on the APOGEE Stellar Parameter and Chemical Abundances Pipeline (ASPCAP) for all 18 CAPOS BGCs.
Methods. We used atmospheric parameters, abundances, and velocities from ASPCAP in DR17.
Results. First, we carried out a stringent selection of cluster members, finding a total of 303 with a spectral signal-to-noise value of S/N>70 and an additional 125 with a lower S/N. We confirmed the result of prior ASPCAP multiple population studies, namely, that stars with high [N/Fe] abundances show higher [Fe/H] than their lower [N/Fe] counterparts. Furthermore, the Mg, Ca, and global α abundances exhibit similar trends, while Si is well-behaved. The [Fe/H] value of these second-population stars was corrected to derive the mean metallicity. Mean metallicities were determined to a precision of 0.05 dex, [α/Fe] to 0.06 dex, and radial velocity to 3.4 km/s. No clusters displayed any strong evidence of internal metallicity variations, including M22. Abundances for eleven other elements using only first-population stars were calculated. Our values are shown to be in good general agreement with the literature. We developed a new chemodynamical GC classification scheme, synthesizing the results of several recent studies. We also compiled a set of up-to-date metallicities. The BGC metallicity distribution is bimodal, with peaks near [Fe/H] = −0.45, and −1.1, with the metal-poor peak displaying a strong dominance. The entire in situ sample, including disk and BGCs, displays the same bimodality, while ex situ GCs are unimodal, with a peak around −1.6. Surprisingly, we see only a small and statistically insignificant difference in the mean [Si/Fe] of in situ and ex situ GCs. The four GCs with the lowest [Si/Fe] values are all ex situ and relatively young, with three belonging to Sagittarius; no other correlations are evident.
Key words: stars: abundances / galaxy: bulge / globular clusters: general
© The Authors 2025
 Open Access article, published by EDP Sciences, under the terms of the Creative Commons Attribution License (https://creativecommons.org/licenses/by/4.0), which permits unrestricted use, distribution, and reproduction in any medium, provided the original work is properly cited.
This article is published in open access under the Subscribe to Open model. This email address is being protected from spambots. You need JavaScript enabled to view it. to support open access publication.
1 Introduction
Understanding galaxy formation and evolution is a key goal of modern astronomy. A critical target is our own Milky Way (MW) galaxy. To piece together the physical processes involved and how they have interacted requires probing witnesses of the ancient epoch of MW formation, which still survive today to bear testimony, and comparing the evidence derived from these witnesses to theoretical simulations. Globular clusters (GCs) fully fulfill the requisite attributes of ideal witnesses. They are bright (with some low-luminosity as well), numerous, inhabit all major MW components (bulge, disk, and halo) and, most importantly, ancient but nonetheless yield very precise and accurate ages. Hence, they are among our most powerful Galactic archaeological tracers.
In recent years, we have learned a tremendous amount about the history of the halo from its GCs, which are the most accessible GC system, with little or no extinction, and thus stand as the classic prototype GC population. However, these observations, along with recent simulations, have demonstrated that the halo was mostly accreted (Tumlinson 2010; Massari et al. 2019). Thus, studying the halo GCs tells us a great deal about the accretion history of the MW, but not about the origin of its native, in situ population. For this, we must turn to the Galactic bulge (GB) and Galactic disk (GD), whose simulations strongly suggest were mainly formed in situ (Gargiulo et al. 2019). Thus, it is imperative to investigate GB and/or GD GCs (B+D GCs) to reveal the oldest, in situ Galactic component (referred to hereafter as the main progenitor) and its history.
Fortunately, both the GB and GD possess significant GC populations that are poised to share their secrets regarding the most innate nature of our Galaxy. Belokurov & Kravtsov (2024) have classified fully two-thirds of Galactic GCs as in situ. This ratio will only increase, as significant numbers of new GCs continue to be found, mostly in the bulge or disk. Recently, Bica et al. (2024) listed a total of 39 newly identified GCs and candidates, of which only seven are associated with the halo. Unfortunately, until recently we have not been able to unleash the full power of the B+D GCs to help unravel the history of the main progenitor, due to the high extinction and severe crowding toward the plane and central regions of the MW. The recent advent of near-IR high spatial resolution imaging, as well as high spectral resolution spectroscopy, has finally opened the window to investigating Galactic archaeology in depth via B+D GCs.
The bulge Cluster APOgee Survey (CAPOS, Geisler et al. 2021, hereafter G21) is designed to exploit this spectroscopic opportunity. The primary goal of CAPOS is to obtain detailed abundances and kinematics for a large sample of bona fide members in a number of B+D GCs using the unique advantages of the high resolution (R~22 500) APOGEE-2S instrument (Wilson et al. 2019) attached to the du Pont 2.5 m telescope at Las Campanas Observatory (Bowen & Vaughn 1973) as part of the fourth iteration of the Sloan Digital Sky Survey (SDSS-IV; Blanton et al. 2017).
In the first CAPOS paper (G21), we included an overview of the project and initial results based on the APOGEE Stellar Parameters and Chemical Abundance Pipeline (ASPCAP) (García Pérez et al. 2016) analysis of the CAPOS data for the seven B+D GCs released in DR16 (Ahumada et al. 2020). We deferred treatment of the eighth cluster, NGC 6656 (M22), due to its likely ex situ (Pérez-Villegas et al. 2020, hereafter PV20) and metal-complex (Norris & Freeman 1983) nature. In that work, we described in detail cluster and cluster membership selection for all CAPOS fields available at that time, as well as the selection of bulge field stars, K2 stars (Stello et al. 2017), EMBLA stars (Howes et al. 2016) and PIGS stars (Arentsen et al. 2020). These field stars were included to fill fibers that could not be targeted on GCs due to fiber collision limits with higher priority cluster targets.
In our detailed ASPCAP abundance analysis in G21, we found a trend among each of our clusters for stars with the highest N abundances, which were originally called second-generation (2G) stars, but here we refer to them as 2P stars to link them to second-population stars in the multiple population (MP) phenomenon. They display a higher metallicity than their first-generation/first-population (1G/1P) counterparts. We interpret this as being due to a known issue with ASPCAP in overestimating effective temperatures for 2P stars, with their unique abundance ratios. We used the metallicity of 1P stars to correct the [Fe/H] values for 2P stars. We used these corrected values together with the uncorrected 1P values to derive the mean [Fe/H] for our clusters. We also calculated the mean abundances for eleven other elements in 1P stars that were not expected to be affected by MP, the mean [α/Fe], and the mean radial velocity. We explored the MP in the seven CAPOS B+D GCs investigated.
DR16 contained APOGEE data taken by June 2019, which only included three CAPOS fields. These three fields include, as already mentioned, seven B+D GCs, NGC 6656, and a candidate GC from Minniti et al. (2017a). Subsequent CAPOS observations were obtained in July 2019 and October 2020 for ten additional B+D GCs and two additional Minniti et al. candidates in five new CAPOS fields, as well as additional exposures for some of the objects studied in G21.
Here we present results for all 18 CAPOS clusters, including NGC 6656, contained in DR17 (Abdurro’uf et al. 2022), which comprises all APOGEE data obtained for this project. We basically followed the same procedure as in G21, first discussing the cluster sample and our observations (Section 2) and membership selection (Section 3). We then considered the atmospheric parameters, including investigations of any effect of MP on the metallicity and other elemental abundances (Section 4). Next, we derived the mean metal and [α/Fe] abundances and radial velocity (Section 5) and other mean elemental abundances (Section 6) for each cluster, utilizing ASPCAP abundances from DR17. We then compared our values to previous studies. Section 7 examines the salient implications of these results, including the nature of our sample, which presents a revised chemo-dynamical classification for all Galactic GCs, a discussion of the BGC metallicity distribution (MD), and a comparison of the MDs and [α/Fe] distributions of in situ versus ex situ GCs. Finally, Section 8 summarizes our work. The appendix investigates the reality of the three Minniti et al. candidates. We note that other papers in this series present results derived for some CAPOS GCs using independent photometric atmospheric parameters and an abundance analysis using the BACCHUS code (Masseron et al. 2016). Here, we include a comparison to these studies.
2 Cluster sample and observations
The CAPOS cluster selection was described in detail in G21. In brief, our targets were presumed to be bulge GCs (BGCs), based on a variety of sources (see details in G21), lying within the innermost ±10° in latitude and longitude around the Galactic center, and not planned to be observed with APOGEE-2S as part of the main SDSS-IV survey. Indeed, as shown in Figure 1 of G21, although the SDSS-IV APOGEE survey (Majewski et al. 2017) included a large number of fields in the central 10°, only a small number of BGCs were actually observed by the survey. Our observations were generally obtained before Gaia DR1 and thus we limited our definition of BGCs to their three-dimensional spatial location, using a 3.5 kpc Galactocentric distance maximum limit for the bulge. We ignored the cluster metallicity, orbit, and origin, especially since these latter two were essentially unknown until the advent of Gaia data, while the MD of bona fide BGCs was (and remains) uncertain, particularly the lower limit. We prioritized fields with multiple BGCs. The last field observed, containing NGC 6717, is a few degrees beyond our nominal 10° limit. It was selected for its extreme right ascension and, in fact, was the last bulge field observed by APOGEE-2S as part of SDSS-IV. Although NGC 6656 is outside of our limiting Galactocentric radius for BGCs, it is an interesting GC in its own right, having been the subject of considerable debate regarding whether or not it has an intrinsic metallicity spread (e.g., Norris & Freeman 1983; Mucciarelli et al. 2015) and was readily observed simultaneously with the BGC NGC 6642.
Table 1 gives basic positional data for all CAPOS clusters, including the APOGEE field ID, while Table 2 lists additional basic parameters from the literature for the clusters. The final CAPOS sample now includes a total of 18 GCs. We note that we added FSR 1758, which was not included in the same table in G21, as it did not appear in the Harris (2010), hereafter H10) catalog at the time of our original selection, but was discovered subsequently (Barba et al. 2019). It fortuitously falls within the same APOGEE field as two other cataloged BGCs, enabling us to target possible members in time for our observations.
We also obtained data for three candidate GCs from Minniti et al. (2017a): dubbed Minni 6, 51, and 66. These will be discussed briefly in the appendix, but are not included in our final compilation as none of these candidates show evidence from our study for being a star cluster. We also note that while not all of our clusters are now considered bona fide BGCs, 14 of the original 16 considered to be BGCs are indeed now classified by us (Section 7) as bona fide BGCs, while the other two are disk GCs (DGCs). The two extra GCs observed “gratis” in the same fields as our main targets are classified as ex situ (FSR 1758) or unknown as to whether they are in or ex situ (NGC 6656), as we also discuss below.
Finally, although some of our clusters (and indeed some of our actual cluster members) were also observed by other SDSS-IV programs with APOGEE, we opted to include only the data obtained by the CAPOS survey in this paper. We also chose not to discuss results from any of the field stars targeted in CAPOS, leaving these for subsequent papers.
3 Cluster membership selection
In G21, final membership selection was made post-observation using the APOGEE DR16 catalog, where we utilized ASPCAP radial velocities (RVs) and metallicities and Gaia DR2 proper motions (PMs) as the membership criteria. For the abundance analysis, we eliminated potential members with signal-to-noise ratios of S/N<70 for consistency with other GC papers based on APOGEE (e.g., Meszaros et al. 2020). We have optimized and improved our selection procedure in this study. For this purpose, we employed the APOGEE DR17 catalog, focusing on the parameters provided by the ASPCAP pipeline. This release includes more fields, more clusters, more stars, and, in some cases, a better S/N for some previously selected stars than the results available in G21. Additionally, we incorporated information provided by Gaia DR3 regarding PM, along with the study conducted by Vasiliev & Baumgardt (2021), which is available in the dedicated website of the authors1. The latter study primarily uses Gaia DR3 data to characterize the PM of most of the Galactic GCs and it substantially improves our new membership selection.
APOGEE DR17 provides precise RVs, typically accurate to ~0.05 km s−1, and metallicities determined by ASPCAP with a precision better than 0.10 dex, for stars with S/N≥70, which provides key membership information. Additionally, Gaia DR3 has provided astrometric data for practically all stars observed by APOGEE. We note that, although the CAPOS clusters are generally quite reddened, the stars observed by APOGEE were limited to the brightest few magnitudes of the RGB, ensuring that Gaia data were available for all stars in our sample. Table 1 lists each selected GC in this study with its corresponding APOGEE field, which, in most cases, contains more than one CAPOS GC.
Below, we detail the membership selection process step by step. Figure 1 graphically illustrates our criteria and procedure for one of our sample, NGC 6380. We note that this cluster is not very offset from the field in terms of RV or PM (in contrast to the other two clusters in this APOGEE field), but our procedure is still able to pick out the cluster stars with high probability. First, we selected only stars within the tidal radius, for which we used the value defined by Vasiliev & Baumgardt (2021).
Second, we used the PM from Gaia DR3 for each star along with the determination of the mean PM for each GC determined by Vasiliev & Baumgardt (2021). We used a maximum radius of 0.5 mas yr−1 from the PM centroid for almost all CAPOS GCs to maintain homogeneity. Our analysis shows that this radius is optimal for maximizing members and minimizing contamination from field stars. However, for the lone case of NGC 6656, we extended this radius to 1.0 mas yr−1 for two reasons. First, this cluster presents around 400 potential members in APOGEE DR17, with many likely members from the other criteria lying between 0.5 and 1.0 mas yr−1. Second, this GC is relatively isolated from field stars in the PM diagram. Thus, the contamination from field stars is minimal, even out to 1 mas yr−1.
For a third constraint, we used the ASPCAP RVs. These were compared with the mean and dispersion determined by Vasiliev & Baumgardt (2021). In Figure 1, in the bottom left panel, their mean is shown in cyan, along with its corresponding dispersion represented by the error bars. For our selection, we considered stars within 2σ from the mean.
The fourth criterion was metallicity. In general, the average metallicity of the CAPOS GCs has been previously derived using a variety of methods. H10 lists these metallicities in his catalog. In addition to this, considering that GCs generally do not exhibit a large dispersion in metallicity, and taking into account that ASPCAP provides an uncertainty of ~0.10 dex, we considered stars with a metallicity given by ASPCAP <3σ from the cluster mean given by Vasiliev & Baumgardt (2021) as members. Additionally, we verified that all our targets are located in the main branches (RGB or AGB) corresponding to the CMD of each cluster.
Finally, we used all members irrespective of their S/N to calculate the mean RVs of each GC, using a mean weighted by their S/N (see Table 4). It is important to note, however, that the star with the lowest S/N is 29 and a number of authors have demonstrated that stars with even lower APOGEE S/Ns can still provide excellent RV values (Muñoz et al. 2023; Nidever et al. 2020). However, we separated the stars with S/N>70 as these were the only ones used for the determination of chemical abundances, following the recommendation of previous studies, such as Meszaros et al. (2020) and in keeping with G21. In Table 3, we list the total number of stars selected for each GC in the column labeled all CAPOS stars, as well as the number with S/N>70, along with the mean metallicity we derived. This extensive, multidimensional culling procedure ensures very high-quality membership probability for our final surviving candidates.
Additionally, we compared our selection with that made by Schiavon et al. (2024 – hereafter S24), who also used the same DR17 ASPCAP catalog derived from the APOGEE survey. We note that their study encompasses all Galactic GCs observed by APOGEE, unlike the present study, which focuses only on the CAPOS GCs. In addition, our selection is based only on stars observed for the “CAPOS” program, while S24 uses all available stars without discriminating between programs (i.e., for a few of our GCs, observations were obtained with APOGEE independently of CAPOS). We note that S24 specifically designed their study to “generously consider every star with a reasonable probability of belonging to a given GC” and to this end, they provided information to users so they could make their own “informed sample selections”. Thus, catalog completeness was prioritized over purity. In contrast, we prioritized purity over completeness, so we expect our sample to have fewer candidate members overall than S24 and some of their candidates would likely end up as non-members. In fact, the VAC would have been an excellent starting point for our membership selection, but we completed our selection before S24 was published.
This comparison is shown in Table 3. In general, we found good agreement with the results of S24. However, as expected, we found some differences between stars selected in the two studies for several clusters. The main differences are due to stars selected by S24 that lie outside the tidal radius that we used in this study, or fall beyond the 0.5 mas yr−1 PM radius we defined. In these cases, selection clearly depends on the criteria adopted by each author. In this study, we used the tidal radius and mean PM values defined by Vasiliev & Baumgardt (2021). In addition, we found that some stars selected by S24 present a metallicity or RV value determined by ASPCAP which is in substantial disagreement with our GC mean. We note that S24 did not include a metallicity criterion for all of their candidates to avoid missing members for which a metallicity solution was unavailable or those with potentially large errors in metallicity, as well as to also allow the possibility of candidates with a real metallicity spread.
In Figure 2, we present an example of the comparison for the cluster NGC 6380, where we show both selections. We note several clear differences in the selection. First, five stars chosen by S24 are located outside the tidal radius of 14.1 arcmin adopted here. Also, eight stars lie substantially farther than 0.5 mas yr−1 from the center of the GC in the PM diagram. Finally, in the bottom-left panel of Figure 2, we note that several stars have RV and/or metallicity values exceeding the limit we defined, with respect to the mean. This clearly leads to a difference in mean metallicities between the two studies; in this case, the mean metallicity derived by S24 is −0.78 dex, in contrast to our significantly more metal-poor value of −0.90 dex (see Table 3). Again, such differences are to be expected, considering that S24 aims to include the largest possible number of potential cluster members with a reasonable probability.
Finally, we found that some stars reported as members in S24 are duplicated or even triplicated. This situation was acknowledged by S24 and it is mainly due to the fact that there are multiple entries for stars located in overlapping fields and observed as part of different programs. The CAPOS GCs with repeated members in the S24 catalogue are HP1, Terzan 9, NGC 6380, and NGC 6656. It is quite likely that such duplication, as well as the inclusion of low membership probability stars described above, also occurs in other non-CAPOS GCs. However, field star contamination increases significantly toward the bulge, which is precisely the focus of this study, and contamination is certainly far less problematic at high Galactic latitudes, where the remaining APOGEE VAC sample is primarily located.
Basic positional data for all CAPOS clusters.
Basic parameters from the literature for all CAPOS clusters.
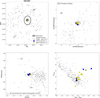 |
Fig. 1 Membership determination in NGC 6380, including location with respect to tidal radius (top-left), PM space (upper right), metallicity-RV space (lower left), and CMD (bottom-right). CAPOS final members are shown in blue, with boxes around those with S/N<70, non-CAPOS members in yellow, and other stars observed by APOGEE in grey. The Vasiliev & Baumgardt (2021) mean RV and error are shown in cyan. The clustering seen in the grey points are due to two other GCs observed in the same CAPOS field. |
Comparison with Schiavon et al. (2024) sample and mean metallicity.
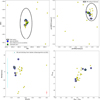 |
Fig. 2 Comparison of our membership determination in NGC 6380 to that of S24. Diagrams and point descriptions as in Figure 1, but with yellow points indicating members selected by S24, and green pentagons showing duplications in their selection. The typical error in PM is about 0.01 mas yr−1 for both pmRa and pmDec, and in the RV versus metallicity plot, typical errors are shown in red. S24 included a number of stars that do not satisfy our more stringent membership requirements. |
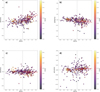 |
Fig. 3 (a) Δ([Fe/H]) (difference in [Fe/H] from the mean based on only 1P stars = those with ([N/Fe]<0.7) as a function of [N/Fe]. A clear trend is found for 2P (higher [N/Fe]) stars to have a higher [Fe/H] than 1P stars in the same cluster, with the difference in metallicity increasing with increasing [N/Fe] for 2P stars. The best-fit line is shown for 2P stars. (b) As in a) but for [Mg/Fe]. (c) As in a) but for [Si/Fe]. (d) As in a) but for [Ca/Fe]. The stars are color-coded according to metallicity in each panel. |
4 Atmospheric parameters
The ASPCAP pipeline derives stellar parameters and metallicities from a global fit to the entire spectrum, along with detailed abundances for more than 20 elements by fitting the spectral lines to models using these atmospheric parameters. We note that here we use the ASPCAP-calibrated, spectroscopic atmospheric parameters and abundances.
In G21, while investigating the reliability of these parameters, we found a significant positive gradient of increasing metallicity with temperature within a cluster, of similar magnitude for most clusters, although data were sparse. We also found a clear trend within each of our clusters for stars with the highest [N/Fe] abundances to also show a higher metallicity than their cluster counterparts with lower [N/Fe]. This behavior is consistent with the Jönsson et al. (2018) finding that ASPCAP overestimates (with respect to the optical studies taken as reference) effective temperatures as well as surface gravities for so-called 2P stars, namely, stars with abundance patterns typical of stars believed to have been born from gas polluted by evolved 1P stars to form another population(s), leaving a present-day cluster displaying MP, which are found in essentially all GCs above a minimum mass or mass density threshold (Carretta et al. 2009; Huang et al. 2024). We note that none of the scenarios so far proposed to explain MPs is able to fully account for the wide variety of observational evidence (Bastian & Lardo 2018).
We reinvestigated this behaviour with the much larger full CAPOS dataset now available. We note that G21 had a total of only 40 cluster members in seven clusters with available spectra having S/N>70, for a mean of 5.7 members per cluster, while the current sample includes a total of 303 members in 18 clusters with S/N>70, for a mean of 16.8 members per cluster. Thus, the current sample is more than seven times larger in total with almost three times as many stars per cluster on average, making the full sample much more robust; although we should add that almost two-thirds of the stars in the full sample now come from only two clusters: NGC 6273 and NGC 6656.
We followed the same procedure as in G21, assigning stars based on the [N/Fe] ratio as either 1P ([N/Fe]<0.7) or 2P ([N/Fe] >0.7). The division at [N/Fe]=0.7, as chosen in G21, again appears very reasonable (also see Meszaros et al. 2020). Other studies have suggested a more appropriate value is [N/Fe]=0.5 (e.g., Fernandez-Trincado et al. 2022, S24). We find that using 0.7 provides a much more statistically significant correlation between Δ([Fe/H]) = [Fe/H]* − < [Fe/H] >1P and [N/Fe] than using 0.5. We also note that our sample is much larger and covers almost the full metallicity range of GCs compared to previous studies. We derived the cluster mean [Fe/H] for 1P stars only, < [Fe/H] >1P, and then plotted the difference Δ([Fe/H]) for all stars in the cluster as a function of [N/Fe]. Figure 3 shows our result, which is very similar to Figure 5 of G21; however it allows us to discern the trend much more clearly due to the increased sample. In G21, we simply divided all stars into 1P or 2P and found a very consistent mean difference of +0.06 ± 0.01 dex for all 2P stars compared to 1P stars in the same cluster. We then applied a correction of −0.06 dex to the [Fe/H] value of each 2P star and then used these corrected values together with the 1P values to derive our final mean cluster metallicity: <[Fe/H]>, which is given in Table 3 of G21.
With our much larger sample, it is now clear that there is not simply a constant offset between 1P and 2P stars but that Δ([Fe/H]) increases roughly linearly with [N/Fe] above 0.7. As our GCs now cover a metallicity range >1.6 dex, much larger than in G21, we also investigate any possible metallicity effects in this trend. All of our clusters exhibit similar behavior within the errors except our most metal-rich GC – NGC 6304. At [Fe/H]~ −0.5, it is about 0.25 dex more metal-rich than the next most metal-rich GC (see Table 4) and it is the only GC which shows no significant difference between the metallicities of 1P and 2P stars. To derive the final mean cluster metallicity <[Fe/H]>, we simply took the unweighted mean of all stars in NGC 6304, while for the other clusters, we corrected each 2P star by the least-squares line shown in Fig. 3, based on its [N/Fe] value, and then averaged this corrected value for each 2P star with the (uncorrected) values for all 1P stars. The equation for this line is Δ([Fe/H]) = 0.22[N/Fe] − 0.14 for [N/Fe] >0.7. This mean value is given in Table 4 along with its standard error. Of course, the above assumes that ASPCAP correctly measures [N/Fe]. Further tests (e.g., Montecinos et al. 2025) comparing ASPCAP to BACCHUS results for 1P and 2P stars suggests that this is indeed a reasonable assumption.
We thus reinforce and clarify the evidence for this behavior found in G21 and the implication that ASPCAP is not optimum for deriving atmospheric parameters for 2P stars, at least not for typical GCs more metal-poor than −0.5, and therefore also not optimum for deriving their detailed abundances, at least Fe. We also investigated what could be responsible for this behaviour. As part of our BACCHUS analysis for CAPOS GCs, we generated independent atmospheric parameters for all stars from photometry and isochrones (e.g., Barrera et al. 2025). We compared the ASPCAP spectroscopic parameters with these photometric parameters for a sample of our stars and find that the offset between them is always larger for 2P stars than 1P stars in both effective temperature and surface gravity, by roughly 100 K and 0.2 dex, respectively, with the actual value metallicity-dependent (Montecinos et al. 2025). This is in accord with the findings of Jönsson et al. (2018). And since ASPCAP overestimates Teff for 2P stars, it will also overestimate [Fe/H] since higher Teff generally means fainter spectral lines and a higher metallicity is required to fit a given line (G21).
As for other elements, it would be expected, given the ASPCAP methodology, that there would be systematic deviations for other elements in 2P stars as well, if the culprit were indeed to come from incorrect atmospheric parameters derived for these stars. Given the importance of the α elements (especially Mg, Si, and Ca within APOGEE), we decided to also investigate the behavior of these elements with regard to the effect on ASPCAP abundances of their MP nature and carried out an analogous analysis on these elements. Figure 3 also shows Δ([Mg/Fe]), Δ([Si/Fe]) and Δ([Ca/Fe]) as a function of [N/Fe]. Although the scatter for 2P stars exceeds that of 1P stars, [Si/Fe] shows only a very small systematic deviation for 2P stars (≤0.03 dex) and only for the most extreme 2P stars. However, Mg and especially Ca are more problematic. 2P stars show a larger scatter compared to 1P stars than for Si, and they also show a mean linear trend with [N/Fe] that becomes quite large (~0.1 dex) for the more extreme 2P stars. Moreover, these lines do not pass thru Δ([Mg/Fe]) or Δ([Ca/Fe]) = 0 at the limit ([N/Fe]=0.7) for 2P stars. Ca shows more scatter for all stars, especially in the clusters more metal-poor than −1.5, and with more metal-rich clusters defining a substantial increase in Δ([Ca/Fe]) for 2P stars, exceeding 0.1 dex for the most extreme 2P stars. Finally, we also investigated the global α parameter. Its behavior is similar to that of Mg. We conclude that we can safely use the ASPCAP [Si/Fe] values for all stars but will limit our Mg, Ca and α abundances, as well as abundances for all other elements except Si, to 1P stars only. Of course, [Si/Fe] may indeed be (slightly) enhanced in 2P stars by the MP phenomenon but our results demonstrate that any potential enhancement is virtually negligible, while other elements like Mg are indeed expected to be more affected by MP. In fact, without further analysis, we are not able to distinguish whether the cause of the distinct abundances for 1P and 2P elements like Mg is due to MP and/or ASPCAP limitations.
Therefore, we will only use 2P stars in this paper to help derive the mean cluster metallicity (using the correction procedure outlined above), the mean [Si/Fe] abundance (without correction), and of course the mean radial velocity (using all stars), and only report on mean abundances for other elements for 1P stars. As described in detail in G21, we further restrict ourselves to elements we deem to have well-determined values for 1P stars in ASPCAP, including C, N, O, Na, Mg, Al, Si, K, Ca, Fe, Mn, and Ni. We do not include Ce, as Hayes et al. (2022) have shown that the ASPCAP Ce abundances are unreliable. We defer derivation of abundances for 2P stars to other papers using boutique analyses (e.g., BACCHUS) to obtain more reliable abundances.
Mean cluster metallicity, [α/Fe], and radial velocity for members.
5 Fundamental cluster parameters: Mean metallicities, [α/Fe] abundances, and radial velocities
The mean metallicity, designated [Fe/H], of a GC is the primary parameter detailing its chemical composition. The next most salient composition indicator is the abundance of the α elements relative to Fe, designated as [α/Fe]. Finally, RVs and their dispersions provide crucial information regarding membership, internal kinematics and the cluster’s orbit and therefore origin. Despite the critical importance of these parameters, among the most fundamental for our understanding of a cluster’s formation and subsequent chemical and dynamical evolution, the current state of our knowledge of these parameters for B+D GCs is woefully inadequate. This is particularly true for most of our current sample. We note that only one of our sample, NGC 6656, was included in the comprehensive APOGEE study of southern clusters in SDSS-IV by Meszaros et al. (2020), and indeed this is almost certainly NOT a BGC. We also applaud the work of Schiavon et al. (2017a) who investigated all five BGCs available in DR12 which were missing from previous APOGEE analyses.
CAPOS was devised to address these deficiencies for as many BGCs as possible, taking advantage of the powerful APOGEE instrument (Wilson et al. 2019), which was designed to deliver high precision RVs and abundances for a large number of elements, including Fe and all of the species considered α elements. In this section, we present and discuss the ASPCAP results for mean [Fe/H], [α/Fe], and RV for the CAPOS clusters.
Table 4 gives our mean values and their standard deviations. We note that the RV was derived from the mean of all CAPOS members (number given in Column 2 of Table 3), irrespective of S/N, while the abundances were derived only for members with S/N>70 (Column 3 in Table 3), but with the metallicities of 2P stars (equal to the number given in Column 3 in Table 3 minus the number in Column 5 in Table 4) corrected via the procedure outlined in Section 4.
5.1 Metallicity
G21 emphasized that previous metallicity information for our clusters, and indeed most B+D GCs, came from a hodgepodge of sources with a large range of precision and accuracy, but mostly of relatively poor reliability and/or not involving near-IR capabilities to help mitigate the extinction problem. Although all of our clusters have been investigated before, the metallicity estimates are generally based on relatively low-quality indices. Needless to say, such studies are very inhomogeneous. CAPOS now provides unprecedented metallicities, of much higher quality than virtually all previous estimates, on a homogeneous scale, and with a relatively large number of high probability members, allowing a substantial improvement in our knowledge of these fascinating, but until now very poorly studied objects, and of the B+D GC systems in general. A recent complementary step in the same direction was undertaken by Geisler et al. (2023 – hereafter G23) who obtained metallicities and velocities from low resolution Ca triplet (CaT) VLT spectra for 12 B+D GCs, including six of the CAPOS sample, and we will compare these two studies in detail, in both mean metallicity and RV.
We address each of our clusters in turn. First, we note that none of them show strong evidence for internal metallicity variations. The sample size in some clusters is relatively small, from 2–9 members with S/N > 70, limiting the statistics, but four clusters have 10–13 stars each and two have a very large number of high quality members. In fact, these two clusters, NGC 6273 and 6656, have the two largest standard deviations in metallicity. But this could be explained by either of two possibilities: one is that these are among the most metal-poor clusters in our sample. Indeed, of the four clusters with [Fe/H] < −1.45, the mean standard deviation of the metallicity determination is 0.093, twice as large as the mean error for the more metal-rich GCs (0.047). ASPCAP is known to have a more difficult time deriving accurate metallicities for such metal-poor giants, given the weaker lines (Nidever et al. 2020). A second possibility is that these two GCs may actually be among the select few that do indeed possess intrinsic metallicity spreads. The history of NGC 6656 is particularly rich and colorful in this regard, with a longstanding debate in the literature about this possibility (Norris & Freeman 1983; Mucciarelli et al. 2015). Our exquisite APOGEE database is the best available to definitively decide on this issue, but details will be left to a future paper. Suffice it to say here that our spread of 0.10 dex is very similar to the scatter of 0.092 found by Meszaros et al. (2020) in their BACCHUS analysis of 20 APOGEE (non-CAPOS) stars in NGC 6656, in which they do not find any significant intrinsic metallicity variation. Similarly, NGC 6273 might be the remnant nuclear star cluster of a nucleated dwarf galaxy a la ω Centauri (Pfeffer et al. 2021) and thus may also possess a small intrinsic metallicity spread (Johnson et al. 2015, 2017). But such spreads in the other GCs are essentially ruled out, certainly in the clusters with more than 5 stars, which is most of our sample.
The historic bible of Galactic GC properties, including metallicity, is H10, so we began with his values and references and also include more recent studies. For the H10 error, we took the error from Carretta et al. (2009) if the H10 metallicity was based on their compilation. For the clusters included in G21, we summarize the most relevant studies here. The recent Ca triplet investigation by G23 also presents detailed metallicity determinations for many of our sample, and again here we only present the most relevant studies. We made a comparison with the S24 value from the APOGEE VAC catalog and also compared the results to those of clusters that have already been the subject of individual investigations of the CAPOS data via BACCHUS. Finally, we also cited any high-resolution studies.
NGC 6273. Our metallicity value is −1.75±0.11 (the standard deviation is quoted here in all cases for our mean), from 62 members with S/N>70, our second-largest sample, including 23 1P stars, and is one of the most metal-poor in CAPOS. The H10 [Fe/H] value for this cluster is −1.74±0.07, based on a variety of non-high resolution spectroscopic methods of reasonable weight, as assessed by him, placed on the Carretta et al. (2009) metallicity scale, with a reasonably low E(B-V)=0.38 for a BGC. This cluster was not included in G21 or G23. S24 find −1.71, a slightly larger value than ours, as expected from their not accounting for the spuriously high metallicity of 2P stars. High resolution spectra apart from APOGEE have been obtained by Johnson et al. (2015, 2017), and Bailin (2019) gives their mean value as −1.612 ± 0.022, but with a large intrinsic spread of 0.16 dex. All values for the mean metallicity are in very good agreement.
NGC 6293. Our metallicity value is −2.12±0.08, from 13 members with S/N>70, including 51P stars. This is the most metal-poor CAPOS cluster. The H10 [Fe/H] value for this cluster is −1.99 ± 0.14, based on a variety of non-high resolution spectroscopic methods of high weight placed on the Carretta et al. (2009) metallicity scale, with a reasonably low E(B-V)=0.36. This cluster was not included in G21 or G23. S24 find −2.09, a slightly larger metallicity than ours, as expected. High resolution spectra apart from APOGEE have not been published to our knowledge. All values are in good agreement.
NGC 6304. Our metallicity value is −0.49 ± 0.06, from 12 members with S/N>70, including 41P stars. This is the most metal-rich CAPOS cluster. The H10 [Fe/H] value for this cluster is −0.45 ± 0.07, based on a variety of non-high resolution spectroscopic methods of reasonable weight placed on the Carretta et al. (2009) metallicity scale, with an intermediate E(B-V)=0.54. This cluster was not included in G21 or G23. S24 find −0.48, very slightly larger than ours, as expected from the negligible metallicity effect on 2P stars for this very metal-rich GC. A BACCHUS analysis of our data yields −0.45±0.08 (Montecinos et al. 2025). High-resolution spectra outside of APOGEE have not been published to our knowledge. All values are in excellent agreement.
NGC 6316. Our metallicity value is −0.83 ± 0.05, from 6 members with S/N>70, including 3 1P stars, making this an intermediate metallicity cluster. The H10 [Fe/H] value for this cluster is −0.45 ± 0.14, based on a variety of non-high resolution spectroscopic methods of high weight placed on the Carretta et al. (2009) metallicity scale, with an intermediate E(B-V)=0.54. This cluster was not included in G21 or G23. S24 find −0.77, slightly larger than our value, as expected. A BACCHUS analysis of our data yields −0.87 ± 0.08 (Frelijj et al. 2025). High resolution spectra apart from APOGEE have not been published to our knowledge. Our value is 0.38 dex lower than the H10 value, pointing to the difficulty of obtaining accurate metallicities for such GCs.
Terzan 2. We found a mean metallicity value of −0.88 ± 0.02, from only three members with S/N>70 (ASPCAP does not provide abundances for one star), including two 1P stars. This is another intermediate metallicity cluster. The H10 [Fe/H] value for this cluster is −0.69, based on low resolution near-IR spectra. Terzan 2 is very heavily reddened, with E(B-V)=1.87. G21 give [Fe/H] = −0.85 ± 0.04, while G23 find −0.54 ± 0.10 from CaT spectra of eight members, similar to the value of −0.42 ± 0.18 derived by Vasquez et al. (2018) from the same technique. S24 find −0.86, slightly larger than our value, as expected. Our CAPOS BACCHUS study yields −0.84 ± 0.04 (Uribe et al. 2025), which includes the 4th member for which ASPCAP did not provide abundances. High resolution spectra apart from APOGEE have not been published to our knowledge. There is a range of almost 0.5 dex in these values, with ours being the lowest, again pointing to the difficulty of obtaining accurate metallicities for such highly obscured GCs and such small samples.
Terzan 4. Our metallicity value is −1.41 ± 0.04, from only three members with S/N>70, including two 1P stars. This is a metal-poor cluster. The H10 [Fe/H] value for this cluster is −1.41, based on low resolution near-IR spectra. Terzan 4 is very heavily reddened, with E(B-V)=2.0. G21 give [Fe/H] = −1.40 ± 0.05. G23 did not observe this cluster. S24 find −1.38, slightly larger than our value, as expected. Our CAPOS BACCHUS study yields −1.42 ± 0.08 (Sepulveda-Lopez et al., in prep.) Origlia & Rich (2004) derive −1.60 based on high-resolution near-IR spectra of four stars using the Keck NIRSPEC instrument. Our mean metallicity is in perfect agreement with that of H10, which is undoubtedly a case of serendipity, given its highly obscured nature and our small sample size. It is also in excellent accord with G21 but almost 0.2 dex higher than the Origlia & Rich value.
HP1. We derived a mean metallicity value of −1.23 ± 0.07, from ten members with S/N>70, including two 1P stars. This is another metal-poor cluster. The H10 [Fe/H] value for this cluster is −1.00, based on low resolution near-IR spectra as well as high-resolution spectra of two stars (Barbuy et al. 2006). HP1 is highly reddened, with E(B-V)=1.12. G21 find [Fe/H]=−1.20 ± 0.10, while G23 did not observe this cluster. S24 find −1.21, slightly larger than our value, as expected. A BACCHUS analysis of our data yields −1.15 ± 0.08 (Henao et al. 2025). VLT UVES studies have been carried out by Barbuy et al. (2006, 2016). In the latter paper, they combined their sample for a total of eight stars, deriving a mean metallicity of -1.06 ± 0.15. All values are in good agreement, although our value is the lowest.
FSR 1758. Our metallicity value is −1.48 ± 0.08, from nine members with S/N>70, including two 1P stars. This also is a metal-poor cluster. H10 did not include this object in his catalog as it was undiscovered at the time. It has a fairly high E(B-V)=0.9. This cluster was not included in G21 or G23. Romero-Colmenares et al. (2021) analyzed the CAPOS spectra but using the BACCHUS package, deriving a mean metallicity of −1.36±0.08. S24 find −1.42, a slightly larger value than ours, as expected. High resolution spectra apart from APOGEE have been obtained by Villanova et al. (2019), yielding a mean metallicity of −1.58 ± 0.03, in good agreement with our value.
NGC 6380. We found a mean [Fe/H] = −0.90 ± 0.02, from four members with S/N>70, including three 1P stars. This is an intermediate metallicity cluster. The H10 [Fe/H] value for this cluster is −0.75 ± 0.09, based on a variety of non-high resolution spectroscopic methods of low weight placed on the Carretta et al. (2009) metallicity scale, with a high E(B-V)=1.17. This cluster was not included in G21 or G23. Fernandez-Trincado et al. (2021a) analyzed only 2 of the CAPOS stars plus a number of additional members observed by another APOGEE program and used the BACCHUS package, deriving a mean metallicity of – 0.80 ± 0.04, with the discrepancy presumably due in part to the different samples. S24 find −0.78, which is significantly higher than our value. As discussed above, NGC 3680 is a clear example of how S24 included a large number of field stars, which fail one or several of our stricter membership criteria. Figure 2 shows that many of the field stars they included are more metal-rich than the true cluster members, including one star at solar metallicity, 0.8 dex higher than our most metal-rich member, leading to the substantial metallicity discrepancy. To our knowledge, high resolution spectra apart from APOGEE have not been published. Our value is reasonable agreement with H10, but in mediocre agreement with S24, which points to the critical importance of avoiding interloping field stars that can adversely affect cluster means.
Ton 2. We obtained a mean metallicity of −0.73 ± 0.03 from six members with S/N>70, including 3 1P stars. This is another intermediate metallicity cluster. The H10 [Fe/H] value for this cluster is −0.70, based on a variety of non-high resolution spectroscopic methods of very low weight placed on the Carretta et al. (2009) metallicity scale, with a high E(B-V)=1.24. This cluster was not included in G21, while G23 derived −0.57 ± 0.13 from 16 CaT members. Vasquez et al. (2018) found a value of −0.26 ± 0.15 from the same technique. Fernandez-Trincado et al. (2022) analyzed all of the CAPOS spectra but using the BACCHUS package, and derived a mean metallicity of −0.70 ± 0.05. S24 find −0.74, slightly lower than our value because they include a number of members observed by APOGEE but not by CAPOS, in addition to also including one very metal-poor field star as well as neglecting the correction for 2P stars. As far as we know, high-resolution spectra (apart from those from APOGEE) have not been published heretofore. Our metallicity is in excellent agreement with that of H10, in reasonable accord with the G23 CaT value, but in very poor agreement with the Vasquez CaT value.
Terzan 9. Our metallicity is −1.42 ± 0.04, from 9 members with S/N>70, including four 1P stars, making this a low metallicity cluster. The H10 [Fe/H] value for this cluster is −1.05, but note that Carretta et al. (2009) give −2.07±0.09. Terzan 9 is very heavily reddened, with E(B-V)=1.76. G21 give [Fe/H] = −1.40 ± 0.07, while G23 find −1.15 ± 0.12 from CaT spectra of 14 members, similar to the value of −1.08 ± 0.14 derived by Vasquez et al. (2018) from the same technique. As expected, S24’s value of −1.36 is somewhat larger than our value. No other high resolution spectra apart from APOGEE exist. There is a range of over 1 dex in these values, with ours being near the middle, and the 2 CaT values substantially higher.
Djorg 2. Our metallicity value is −1.14 ± 0.04, from six members with S/N>70, including three 1P stars. This is an intermediate metallicity cluster. The H10 [Fe/H] value for this cluster is −0.65, with this value being based on measurements of very low weight. Djorg 2 has a fairly large reddening, with E(B-V)=0.94. G21 give [Fe/H] = −1.07 ± 0.09, using an additional member that we do not include, while G23 find −0.67 ± 0.10 from CaT spectra of only 2 members, substantially higher than the value of −0.97 ± 0.13 derived by Vasquez et al. (2018) from the same technique. Once again, as expected, the S24 value of – 1.07 is somewhat larger than our value. Our CAPOS BACCHUS analysis finds −1.04 ± 0.06 (Pino-Zuniga et al. 2025). Kunder & Butler (2020) use our CAPOS sample and ASPCAP to derive −1.05 ± 0.08, again ignoring any effect on 2P stars. High resolution spectra apart from APOGEE have not been published to our knowledge. Our value is in poor agreement with those of H10 and G23, but in reasonable accord with that of Vasquez et al. (2018).
NGC 6540. Our derived metallicity is −1.09 ± 0.06, from four members with S/N>70, including only 1 1P star. This is an intermediate metallicity cluster. The H10 [Fe/H] value for this cluster is −1.35, with low weight based on high resolution but low-S/N optical spectra. NGC 6540 has an intermediate reddening, with E(B-V)=0.66. G21 give [Fe/H] = −1.06 ± 0.06, while G23 find −1.04 ± 0.14 from CaT spectra of five members. S24 find −1.02, somewhat larger than our value, as expected. High resolution spectra apart from APOGEE have not been published to our knowledge. Our value is in poor agreement with H10 but very good accord with G23.
NGC 6558. Our metallicity for this cluster is −1.15 ± 0.03, from four members with S/N>70, including only one 1P star. This is an intermediate metallicity cluster. The H10 [Fe/H] value is −1.32 ± 0.14, based on a variety of methods of high weight placed on the Carretta et al. (2009) metallicity scale, including high-resolution optical spectra for five stars from Barbuy et al. (2007), who found −0.97 ± 0.15. NGC 6558 has a relatively low E(B-V)=0.44. This cluster was not included in G21 or G23. S24 find −0.99, a significantly larger value than ours, with a difference that is even larger than expected from their not accounting for the spuriously high metallicity of 2P stars. The additional discrepancy comes mostly from their inclusion of one PM member, which, however, is 0.5 dex more metal-rich than our most metal-rich member. The discrepancy appears to be due to the very low S/N (i.e., 10) of this star, yielding a poor ASPCAP metallicity. Gonzalez-Diaz et al. (2023) use our CAPOS sample and BACCHUS to derive −1.15 ± 0.08. Barbuy et al. (2018b) assessment of −1.17 ± 0.10 from high-resolution spectra of 4 RGB stars is almost identical to ours while H10 is significantly lower.
NGC 6569. For this cluster we found a mean [Fe/H] = −1.03 ± 0.05, from seven members with S/N>70, including four 1P stars, so it is another intermediate metallicity cluster. The H10 [Fe/H] value is −0.76 ± 0.14, based on a variety of non-high resolution spectroscopic methods of high weight placed on the Carretta et al. (2009) metallicity scale, with an intermediate E(B-V)=0.53. This cluster was not included in G21 or G23. S24 find −0.92, a significantly larger value than ours, with a difference even larger than expected from their not accounting for the spuriously high metallicity of 2P stars. The additional discrepancy comes from their inclusion of 2 PM non-members that are also as much as 1.2 dex more metal-rich than our most metal-rich member, once again demonstrating the danger of not eliminating field contaminants. A BACCHUS analysis of our data yields −0.91 ± 0.06 (Barrera et al. 2025). High-resolution spectra apart from APOGEE have been obtained by Johnson et al. (2018), while Bailin (2019) gives the mean value as −0.867 ± 0.014. The agreement with H10 is mediocre but reasonable with Johnson et al. (2018).
NGC 6642. Our metallicity value is −1.11 ± 0.04, from ten members with S/N>70, including six 1P stars. This is yet another intermediate metallicity cluster. The H10 [Fe/H] value is −1.26 ± 0.14, with very high weight based on a variety of methods including low-resolution optical spectra. NGC 6642 has relatively low reddening, with E(B-V)=0.40. G21 give [Fe/H] = −1.11 ± 0.04, using a much smaller APOGEE sample than now available to us, while G23 find −1.11 ± 0.24 from CaT spectra of 19 members. S24 find −1.09, slightly higher than our value, as expected. High resolution spectra apart from APOGEE have not been published to our knowledge. Our value is in good agreement with H10 and perfect accord with G23.
NGC 6656. This is a very nearby and well-studied cluster and it contains by far our largest sample of CAPOS members. APOGEE also obtained a large number of additional stars for a different program, which we do not include here. Our metallicity value is −1.75 ± 0.10, from 125 members with S/N>70, including 58 1P stars. This is a very metal-poor cluster. The H10 [Fe/H] value is −1.70 ± 0.08, based on a variety of methods including multiple high resolution optical spectroscopic studies of extremely high weight placed on the Carretta et al. (2009) metallicity scale, with a reasonably low E(B-V)=0.34. This cluster was not included in G21 or G23. S24 find −1.70, slightly larger than our value, utilizing a large number of the additional APOGEE stars not included in CAPOS.
A sample of these additional APOGEE stars were analyzed by Meszaros et al. (2020), finding −1.524 ± 0.112 from 20 stars with S/N>70. Correcting for internal error in the abundance determination, their overall estimate of the intrinsic metallicity error is 0.092. They did not confirm a metallicity variation in NGC 6656, which is controversial. Other recent high-resolution spectra apart from APOGEE have been obtained by Marino et al. (2011) and Mucciarelli et al. (2015), and Bailin (2019) gives their mean value as −1.803 ± 0.015, again with no strong evidence for an intrinsic metallicity dispersion. However, more recently McKenzie et al. (2022) did find evidence for a significant metallicity spread. Although our error is relatively high, as discussed above, this is expected for such a metal-poor cluster; thus, we reinforce the likelihood that NGC 6656 does not possess a large intrinsic metallicity spread (if any at all). We also note that we did not correct our estimate of the intrinsic metallicity error for the internal error in abundance determination. Muñoz et al. (2021) also concluded that NGC 6656 is not likely to have a strong intrinsic metallicity spread (if any at all). The agreement between our mean metallicity and that of H10 is very good, presumably because the latter value is due to many high-resolution studies, and is also in agreement with recent non-APOGEE high-resolution studies. The reason for the offset with Meszaros et al. is uncertain.
NGC 6717. Our metallicity value is −1.17 ± 0.05, from only two members with S/N>70, both 1P stars. This is yet another intermediate metallicity cluster. The H10 [Fe/H] value for this cluster is −1.26 ± 0.07, based on a variety of non-high resolution spectroscopic methods of medium weight placed on the Carretta et al. (2009) metallicity scale, with a reasonably low E(B-V)=0.22. This cluster was not included in G21 or G23. S24 find −1.12, a slightly larger value than ours. However, the cause is not due to 2P stars as there are none observed in this cluster, but instead due to an outlier beyond the tidal radius in our analysis which was included by S24 which has a higher metallicity than our members. High-resolution spectra apart from APOGEE have not been published to our knowledge. Our value is in good agreement with H10.
In summary, our mean metallicities are generally in good to very good agreement with previous high quality spectroscopic studies, but these are limited due to the high extinction that most of our sample suffers. The metallicity correction we make for 2P stars can make a substantial difference in the final mean metallicity derived from previous ASPCAP studies like S24. Agreement with previous lower quality spectroscopic or photometric determinations, particularly those based on optical data, is more variable; this is expected given the less precise data. We emphasize that the near-IR, high-resolution and high-S/N observations, relatively large sample sizes and excellent membership probabilities, as well as homogeneous abundance derivations, make our CAPOS results unparalleled.
Nevertheless, clearly any high resolution abundance analysis depends on many factors such as the atmospheric parameters used. There are now BACCHUS analyses for 11 CAPOS GCs where we can compare results. We note that the samples are generally the same but occasionally slightly different, as noted above, and that the BACCHUS analyses use atmospheric parameters derived from photometry, unlike the spectroscopic ones in ASPCAP. For this sample, we find that the ASPCAP mean [Fe/H] is 0.05 ± 0.06 dex lower than the BACCHUS mean. We consider this difference to be within the respective errors.
5.2 The α-elements
The α-elements play a crucial role in divulging the chemical evolution of a system, in particular the past rate of star formation, as well as information on the IMF. In concert with the metallicity, they reveal the onset of the dominance of SNe Ia over SNe II. In addition, a detailed knowledge of the [α/Fe] abundance ratio is critical to derive an accurate age estimate from a GC deep CMD.
As noted in G21, there is some freedom as to which particular element or combination thereof to use to best represent the α abundance from APOGEE data. All four different possibilities investigated here (global α, Mg, Si, and Ca, listed in Table 5) are all very well-determined in all of our sample, with typical errors of the mean of ~0.05 dex; with the exception of global α and especially Ca in the most metal-poor clusters, which possess large spreads. All four mean values for a given GC are also in good accord, with the different means falling within about 0.1 dex. There are some small systematic offsets – on average for our sample, the highest mean cluster abundance is that of [Mg/Fe], followed by [α/Fe] (0.03 dex lower), [Si/Fe] (0.06 dex lower), and finally [Ca/Fe] (0.11 dex lower). These offsets are quite similar to what we found in G21 for a subset of our clusters, as expected. It is likely that the differences are real and that small real mean abundance differences exist among these elements, thus exacerbating selecting only one of them to represent all of the α elements. However, we opted for Si as the best representative since it is virtually unaffected by 2P atmospheric parameter issues or abundance variations, as opposed to our selection of global α in G21. We therefore show the mean [Si/Fe] abundance in Table 4 as our best representative of [α/Fe].
We first compared our [Si/Fe] abundances with previous derivations of this ratio using CAPOS data (in some cases supplemented with a small number of additional stars from the main APOGEE survey) and the BACCHUS code, using photometric atmospheric parameters derived in a homogeneous manner. Montecinos et al. (2025) found a mean [Si/Fe] = 0.31±0.10 in NGC 6304, substantially higher than our ASPCAP value of 0.18±0.04. Frelijj et al. (2025) used our CAPOS sample of NGC 6316, supplemented by two additional stars, and their BACCHUS analysis yielded [Si/Fe] = 0.36±0.05, substantially higher than our ASPCAP value of 0.23±0.04. The analysis of Terzan 2 by Uribe et al. (2025) found a mean [Si/Fe] 0.08 dex higher than our value, while that of Terzan 4 by Sepulveda-Lopez (in prep.) is 0.19 dex higher. Henao et al.’s (2025) analysis of our CAPOS sample for HP1 gave [Si/Fe] = 0.45±0.07, substantially higher than our value of 0.23±0.04. Romero-Colmenares et al. (2021) used basically our CAPOS sample (including 2 extra stars) for FSR 1758 to derive [Si/Fe] = 0.33±0.05, somewhat higher than our value of 0.25±0.05. Fernandez-Trincado et al. (2021a) analyzed the CAPOS spectra for NGC 6380 plus a number of additional members, deriving [Si/Fe] = 0.37±0.04, substantially higher than our value of 0.20±0.09. Fernandez-Trincado et al. (2022) analyzed the CAPOS spectra for Ton 2 plus one additional CAPOS member with S/N=63, slightly below our limit of 70, deriving [Si/Fe] = 0.33±0.06, somewhat higher than our value of 0.26±0.05. The recent study of Djorg 2 by Pino-Zuniga et al. (2025) yielded a BACCHUS value of 0.38±0.05, compared to the ASPCAP mean of 0.24±0.03. Gonzalez-Diaz et al. (2023) derived a mean value only 0.02 dex higher than our value of 0.22±0.03 for NGC 6558. Finally, Barrera et al. (2025) basically used the CAPOS sample for NGC 6569 and found [Si/Fe] = 0.35±0.07, slightly higher than our value of 0.29±0.08.
Clearly, BACCHUS mean values are generally significantly higher than the corresponding ASPCAP means, indicating likely systematic effects between the two techniques. There are small differences in the samples for some of the clusters, but the standard deviations in all clusters are quite small compared to the differences; thus, a few additional stars would not be expected to affect the means in any significant way. For these 11 GCs, we found a mean difference of [Si/Fe] (BACCHUS – ASPCAP) = +0.12 ± 0.06, which we considered to be larger than the respective errors. We are unsure of the reason behind this discrepancy. They are indeed based on distinct atmospheric parameters, but we would need to explore whether there are systematic differences related to them. We have begun to investigate this behavior. More details will be given in Montecinos et al. (2025), but a preliminary analysis indicates that, for good Si lines, BACCHUS generally gives a slightly better fit to the observed spectrum than ASPCAP, using the same atmospheric parameters, suggesting that the BACCHUS Si abundances are slightly preferable.
The mean [Si/Fe] for all CAPOS GCs is 0.24 (σ = 0.03), while for S24 the mean for the same sample is 0.23 (σ = 0.05). We note that Kunder & Butler (2020) derive [Si/Fe] = 0.25±0.08 for Djorg 2, 0.01 dex higher than our value, from our CAPOS data but also including a star that we discarded as a non-member.
Next, we compared our [Si/Fe] abundances with previous measurements based on other high resolution spectra. Johnson et al. (2015, 2017) investigated a large number of stars in NGC 6273 and found evidence of three populations: metal-poor with mean [Fe/H] = −1.77±0.08 and [Si/Fe]=0.35±0.10, metal-intermediate with [Fe/H] = −1.51±0.07 and [Si/Fe] = 0.23±0.15 and metal-rich with [Fe/H] = −1.22±0.09 and [Si/Fe] = 0.11±0.21. We find no strong evidence of a spread in either Fe or Si, with a mean [Si/Fe]=0.22±0.07, in the middle of the range found by Johnson et al. (2017). Origlia & Rich (2004) find [Si/Fe]=0.55 for Terzan 4, much higher than our value of 0.22±0.04 and indeed exceeding essentially all high resolution estimates of GC Si abundances. Barbuy et al. (2016) determine [Si/Fe]=0.27 for HP1, within the errors of our value of 0.23±0.04. Barbuy et al. (2007) derived 0.23±0.03 for NGC 6558, virtually identical to our value of 0.22±0.03. Johnson et al. (2018) derived 0.34±0.09 for NGC 6569, in good agreement with our mean of 0.29±0.08. Marino et al. (2011) derived 0.44±0.06 for NGC 6656, in poor agreement with our mean of 0.29±0.06. In conclusion, our values are in general good agreement with the limited literature available, although the systematic offset with CAPOS BACCHUS values is disconcerting.
Mean abundances of first population stars (Si includes 2P stars as well).
5.3 Radial velocity
Radial velocities are powerful membership criteria, provide insight into internal cluster dynamics and serve as key ingredients in deriving the cluster orbit and, thus, constraining its origin. Here, we compare our mean RVs to those in Baumgardt et al. (2019; hereafter, B19), as the best recent global compilation (replacing H10) as well as to G23 for clusters in common.
In general, the agreement with B19 is very good to excellent, but there are some exceptions and two very notable ones. The differences are generally within a few km/s, with five clusters exceeding 5 km/s, but most problematic are Terzan 9 and NGC 6642, whose differences are 40 and 22 km/s, respectively. If we consider all clusters (excluding FSR 1758, which is not included in B19), the mean difference (in the sense us – B19) is 1.5±12.1 km/s, while excluding Terzan 9 and NGC 6642 yields values of only 0.5±4.3 km/s, which are well within the errors. The same values with respect to G23 are 2.9±6.2 km/s, also within the respective errors (the G23 CaT RV errors are larger). Moreover, the differences with G23 for Terzan 9 and NGC 6642 are only 0.3 and 7.2 km/s. We agree with G23 that the B19 RVs for these two clusters are highly suspect. The RV differences for these two clusters are significant and important, and for example would affect the orbital determination as well as the classification to a specific Galactic component. A check on these two clusters with the new RVs from Gaia DR3 gives mean values of 66.7 ± 9.6 km/s for Terzan 9 and −53.7 ± 5.0 km/s for NGC 6642, in excellent agreement with our findings. We note that of the seven clusters with differences with B19 >5 km/s, five of them are the most reddened in our sample, including Terzan 9 (but not NGC 6642). Many of the measurements in the B19 compilation come from optical observations, so the large extinction and thus limited S/N in the optical for such clusters may be the cause of many if not all the discrepancies. Finally, our mean RV is within 2 km/s of that of Villanova et al. (2019) for FSR 1758.
6 Other elements
6.1 Light elements: MP
Of the traditional light elements that APOGEE measures well, all of them are also subject to intrinsic cluster variations due to MP. All of our GCs show MP except NGC 6717 (since our sample only has 1P stars), as seen in Figure 3 (where we implicitly assume that at least N abundances are indeed aptly measured by ASPCAP). We have shown that ASPCAP has issues with the atmospheric parameters and derived abundances for 2P stars for at least some other elements, although we have also shown that Si is virtually unaffected by this. Additionally, Si is also the light element least affected by MP. Therefore we only present mean abundances for all of the other light elements here, in which we use only 1P stars to derive these mean values (Table 5), with the exception of Si, but we defer further discussion of Si until the next section, and postpone analysis of the other light elements and MP in general to future papers in which we derive abundances from BACCHUS, as done in CAPOS papers II-VII (Romero-Colmenares et al. 2021, Fernandez-Trincado et al. 2022; Gonzalez-Diaz et al. 2023; Henao et al. 2025; Barrera et al. 2025; Frelijj et al. 2025, respectively) for several clusters already. We will also not discuss here the K or Ca results (also given in Table 5) because of their relatively large errors, especially for metal-poor clusters.
6.2 Fe-peak elements
ASPCAP produces abundances of the Fe-peak elements V, Cr, Mn, Co, Ni, and Cu. However, the reliability of these abundances can vary with the number of lines, their strengths, limitations of the pipeline, etc. As discussed in G21, Jönsson et al. (2020) have undertaken a painstaking assessment of the reliability of ASPCAP abundances. They rate Mn and Ni as the best Fe-peak species in both accuracy and precision, and find problems with V, Cr, Co, and Cu. Therefore, we abide by their assessment and again only investigate these two elements here (Table 5).
The behavior of the mean [Mn/Fe] and [Ni/Fe] versus [Fe/H] in our clusters is shown in Fig. 4, and compared with the trends of APOGEE (ASPCAP) bulge field stars (Rojas-Arriagada et al. 2020), as well as disk field stars (Hayden et al. 2015; Ernandes et al. 2020). First, notably, our sample covers a metallicity range so far relatively underexplored in both species in both Galactic components, extending to considerably lower metallicities in general. Indeed, the fraction of bulge field stars with metallicities below ~ −1 is very small (Rojas-Arriagada et al. 2020), and although disk stars have all but disappeared at these low metallicities, these elements are poorly studied. However, our results lie well within the bulge field star locus at these low metallicities, so there is good general agreement between our bulge cluster and field star samples in both Mn and Ni.
Measurements of Ni abundances independent of APOGEE are sparse for our clusters, while we found no other published Mn abundances. Johnson et al. (2015) derived < [Ni/Fe] > = −0.02 ± 0.10 in NGC 6273 from 17 stars, comparable to our value of 0.04 ± 0.16, also in good agreement with the mean of −0.05 ± 0.11 from Johnson et al. (2017) from an even larger sample. Villanova et al. (2019) derived < [Ni/Fe] > = −0.09 ± 0.02 in FSR 1758 from 9 stars, comparable to our value of −0.04 ± 0.10. Johnson et al. (2018) derived < [Ni/Fe] > = −0.08 ± 0.05 in NGC 6569 from 19 stars, somewhat lower than our value of 0.03 ± 0.01.
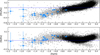 |
Fig. 4 Mean abundance ratio of the Fe-peak elements Mn (top) and Ni (bottom) for each of our clusters (filled blue circles with error bars), compared with APOGEE bulge stars (asterisks – Rojas-Arriagada et al. 2020) and the general trend of disk stars (circles – Hayden et al. 2015). Our BGCs generally follow the bulge field-star trend but extend to lower metallicity. |
7 Major implications
7.1 Nature of our sample: A revised chemo-dynamical classification for Galactic GCs
With the advent of CAPOS, the number of well-studied GCs towards the GB has increased substantially, in particular with regards to detailed abundances and velocities. A new general study of the BGC system is warranted, revisiting such major themes as the chemo-dynamical nature of GCs, the BGC metallicity distribution (MD) and comparison of abundances of in situ versus ex situ GCs.
Here, we follow the spirit of the recent investigation by G23, where they derived mean metallicities and radial velocities from medium resolution CaT spectra of a number of members in each of 12 GCs located toward the GB. They then analyzed the nature of their sample and investigated the BGC MDF. However, first we assessed the nature of our sample with regards to both in versus ex situ status as well as classification of in situ GCs as either GB or GD members, in order to ensure the cleanest sample of genuine BGCs as possible. In the recent past, we were limited to using relatively weak criteria such as position on the sky, distance from the Galactic center, and rather arbitrary metallicity constraints to select what we considered BGCs based on our limited knowledge and understanding of their properties. Bica et al. (2016; 2024; hereafter B16 and B24, respectively) excellent review articles on BGCs limited their sample to GCs with RGC <3kpc and [Fe/H]≥−1.5, with these limits relatively arbitrarily imposed (especially the latter). With the advent of the exquisite proper motions provided by Gaia, our ability to characterize GCs has been revolutionized by adding the powerful dimension of kinematics and dynamics. To this, we can add radial velocities to complete our knowledge of the 6-dimensional position-velocity information required to compute orbits for the clusters, derive their integrals of motion and determine their origin. We note that we will defer the reassessment of orbits based on our RVs to a future paper in this series. Here, we rely on GC orbital assessments from the literature, since the RVs are relatively well-determined from previous data.
We have therefore reassessed the nature of potential BGCs quantitatively and derived a new classification scheme for all Galactic GCs, both with regards to their in situ or ex situ nature as well as to the bulge or disk status of in situ GCs. We made use of a number of recent independent sources that we consider to be most relevant. First, following G23, we used Massari et al. (2019 – hereafter M19), Pérez-Villegas et al. (2020 – hereafter PV20) and Callingham et al. (2022 – hereafter C22). M19 used Gaia DR2 kinematical data to derive the integrals of motion of all Galactic GCs, and assigned them to either of the following classifications: main bulge (MB, 36 GCs), main disk (MD), low energy (LE), high energy (HE), Gaia-Enceladus, Sagittarius, Sequoia, Helmi 99 streams, or XXX (uncertain). We assigned a 1 (in situ) to MB, MD, and LE GCs, and 0 (ex situ) to all other M19 classes. PV20 also used Gaia DR2 kinematics for GCs with RGC <4kpc, classifying them as either bulge or bar (B/B, 29 clusters), thick disk (TD), or inner or outer halo. Again, we assigned a 1 to their B/B and TD GCs, and 0 to the rest. C22 used Gaia DR3 dynamics as well as metallicity to assign probabilities to each class based on a multicomponent model, in a more objective and quantitative fashion. They found 42 likely BGCs and also classified the likelihood of GCs as disk or halo, as well as assessed the likelihood of the latter belonging to various accretion events. We simply adopted their membership probability values for each class. M19 and PV20 used only dynamical criteria to differentiate in and ex situ objects. We note that simulations that include realistic ISM prescriptions suggest that this may be problematic (e.g., Pagnini et al. 2023). Therefore, we also included results from two more recent studies which employ additional parameters, especially chemistry, in their assessments. Belokurov & Kravtsov (2023, 2024; hereafter, BK24) use Gaia EDR3 data to derive the integrals of motion of all GCs and calibrate their classification with [Al/Fe] ratios. They find in situ and accreted GCs are well separated both chemically and dynamically. They then simply classify GCs as in situ or ex situ. Finally, Chen & Gnedin (2024, hereafter, CG24) study clustering of all GCs in 10 variables, including spatial location, dynamics, metallicity and age, again distinguishing only in situ and accreted GCs. We simply used the assessments of BK24 and CG24. We then took the mean of these five different assessments, giving each equal weight, and considered a GC as in situ if the mean was >0.75. We limited our initial sample to all MB or LE objects from M19, and added all B/B GCs from PV20 and all with B>0.66 from C22. We found a total of 83 in situ GCs in this sample of 163 GCs (i.e., comprising slightly more than half).
Several additional chemical tests to distinguish in situ versus ex situ stars and clusters have been proposed. Horta et al. (2021) uses their location in the [Mg/Mn] versus [Al/Fe] plane. Accreted stars purportedly inhabit one quadrant, in situ highα stars another, and in situ low-α yet another. Their Galactic chemical evolution models showed that there must be some contamination of the “accreted” quadrant by “in situ” populations. Vasini et al. (2024) assert that by changing the chemical yields within their error bars, we would obtain trends that differ significantly, making it difficult to draw any reliable conclusion on the star formation history of galaxies from this chemical plane. Given this caveat, and the fact that a large fraction of the sample do not have such data available, we prefer not to use this test in our classification. However, for completeness sake, we show this diagram for our CAPOS clusters in Figure 5. We recall that both Mg and Al are elements affected by MP, and that 2P stars are affected by ASPCAP atmospheric parameter issues, so that only 1P stars have been used to define the mean position of our clusters in this diagram, and that the number of such stars is very limited in many clusters. From their position in this plot, HP1, Terzan 4, FSR 1758, Terzan 9 and NGC 6656 all appear as possible/likely accreted GCs, while all other GCs are either in situ high α or on the cusp between this category and accreted stars.
A second partially chemical distinction has been suggested by Belokurov & Kravtsov (2023) and BK24. They assume that [Al/Fe] is low in dwarf galaxies due to the metallicity dependence of Al yields and use that information to define the locus of accreted versus in situ populations in integrals of motion space. We show the mean location of our CAPOS clusters in their [Mg/Fe] versus [Al/Fe] space in Figure 6. Within the errors, all of the CAPOS sample fall within the in situ region, although Terzan 4, 9 and NGC 6273 are officially slightly within the accreted domain, while FSR 1758, which we classify as our only likely accreted GC, lies slightly within the in situ region. We again prefer not to use this criterion in our selection process due to the lack of similar data for other clusters and the ASPCAP problems for Mg and potentially Al, which limit the sample size since we again restrict our sample to 1P stars. In addition, we note the problems raised by Frelijj et al. (2025) with this test.
Next, we carried out a similar quantitative assessment to determine whether our in situ GCs were either bulge (1) or disk (0) by assigning a 1 to all MB GCs in M19 and a 0 to all other classes, a 1 to all B/B GCs in PV20 and a 0 to the rest, and used the C22 probability value for bulge membership. We then took the equal-weight mean of these three assessments as our final value, and considered BGCs as those with a B/D mean value >0.5. Table 6 lists our final BGC sample and their mean B/D ratio.
The number of BGCs we found (i.e., 40) compares very well with other recent estimates (e.g., 43 from B16, 42 from C22, and 42 from B24, discounting new BGCs). However, our assessment is based on a number of modern high-quality properties and it is quantitative, with no prior assumptions regarding metallicity limits, for example. It also uses chemical criteria, at least in some cases, and not exclusively dynamical criteria, to help avoid any issues raised by Pagnini et al. (2023); for example, that significant overlap between accreted and “kinematically heated” in situ GCs can occur in kinematic space for mergers with mass ratios of 1:10. However, note that B24 have studied possible new BGCs recently discovered in a variety of surveys such as the VVV, and put together a census of all current likely BGCs, with a total of 61, so our list is incomplete as we do not investigate any of the 39 new BGCs they find, since they have not been subject to the above chemo-dynamical analyses in general. We find very good agreement with the B24 classification in detail. Only seven of our BGCs are not classified as such by them: two of our GCs fall below their minimum metallicity limit, two are beyond their angular distance limit and a further three lie outside their Galactocentric distance limit.
A second key step to compiling an up-to-date list of BGCs and their salient properties is adding modern, high quality mean metal abundances. A concomitant recent revolution along with Gaia’s astrometry has been the collection of high quality metallicities for BGCs, many for the first time, as exemplified by CAPOS. We searched the literature for metallicity determinations of our BGCs, limited to high resolution spectroscopic studies, or CaT measures if no high resolution value was available, and prioritizing the most recent studies. We used APOGEE metallicities (CAPOS clusters – this paper, Meszaros et al. 2020 for other APOGEE GCs) when available. The results are also given in Table 6, along with the source. We note that metallicity spreads are extensively documented in both Liller 1 and Terzan 5 (Origlia et al. 2013; Taylor et al. 2022; Fanelli et al. 2024), and we have only given the mean value, whereas all other BGCs appear to be monometallic, given the data used.
It is beyond the scope of this paper to compare the variety of metallicity scales quoted here; we simply presume that the scales are in reasonable agreement, as generally expected for modern high quality spectroscopic values. Having a list of such metallicities for BGCs should be a significant improvement over current catalogs, even that of B24, who use an even wider variety of spectroscopic sources and do not prioritize APOGEE. Unlike B24, we do not attempt to derive MV, distances or ages for our BGCs, as we suspect that, in particular, the latter two parameters require more homogeneous data than currently available to minimize systematic errors. Thus, we refer to B24 for these values.
We carried out the same procedure, including cataloging metallicities, on all other Galactic GCs available from our classification sources, and assembled catalogs of GCs classified as in situ disk (29 GCs), in situ but uncertain as to their disk or bulge nature (14 GCs), and ex situ clusters (61 GCs). We do not include these catalogs here but they are available upon request from the first author.
Only four of the CAPOS sample are not classified as BGCs. NGC 6273 and Ton 2 are considered DGCs, while FSR 1758 and NGC 6656 are found to be ex situ or likely ex situ, respectively. We note that these latter GCs also appear as accreted in Figure 8. In fact, both of these GCs were added to the CAPOS sample only because they could be observed simultaneously with other GCs that indeed turn out to be bonafide BGCs.
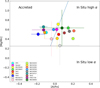 |
Fig. 5 Mean [Mg/Mn] versus [Al/Fe] for CAPOS clusters. We include the purported division between various origins from Horta et al. (2021). |
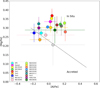 |
Fig. 6 Mean [Mg/Fe] versus [Al/Fe] for CAPOS clusters. We include the purported division between accreted and in situ clusters from BK24. |
Bulge GCs.
7.2 The BGC metallicity distribution
With our compilation of BGCs and their metallicities in hand, we proceeded to investigate their MD. Historically, Morgan (1959) and Kinman (1959) showed that the most metal-rich GCs occupy a relatively small volume of (projected) space near the Galactic center, whereas the metal-poor clusters are spread throughout a much larger volume, the Galactic halo. They first suspected possible distinct GC systems, but no consensus was formed until Zinn (1985) found that the clusters more metal-rich than [Fe/H] = −0.8 have the properties of a disk system, and first established distinct halo and disk systems. Further refinement was performed by Minniti (1995). On the basis of kinematics, spatial distribution, and metallicity, he argued that the metal-rich GCs within 3 kpc of the Galactic center were more appropriately associated with the Galactic bulge, rather than with the thick disk, thereby establishing the BGC system in addition to the halo and disk systems.
The BGC MD has recently been studied by B16, PV20, G23, B24 and Garro et al. (2024). As noted above, B16 and B24 defined BGCs as those with RGC <3kpc and [Fe/H]≥ −1.5, while PV20 used Gaia DR2 astrometry and classified clusters from an orbital analysis. G23 used the classification of Dias et al. (2016). In addition, B16 used H10 metallicities, while those of PV20 and G23 are mostly from low resolution spectroscopy or even photometry, and B24 from a variety of spectroscopic studies. Thus, both our sample selection criteria as well as their metallicities represent substantial improvements over these prior studies.
Our MD is shown in Figure 7 (top). Its major features are in fact quite similar to those of the previously mentioned studies. All show bimodality, with one peak around −1.0 to −1.1, and a second peak near −0.3 to −0.5. A bimodal gaussian fit to our data yields means of −1.08 with σ = 0.24 and 29 GCs in the metal-poor peak, and a mean of −0.45 with σ = 0.16 and 10 GCs in the metal-rich peak. This compares very well to the two means of −1.05 and −0.4 found by B16, which is the study most similar to ours.
The metal-rich peak is the one that is classically associated with B+D GCs (Zinn 1985). However, recent MDs generally show there is also a second, more metal-poor peak, which is actually the dominant one. This is especially true of our MD, where we find that more than 70% of our sample fall in this group.
Another common feature is the presence of a few BGCs at substantially lower metallicity than the metal-poor peak, extending from ~ −1.4 down to −1.8, with two extremely metal-poor GCs below −2. An important issue raised by G23 was the reality of such low metallicity BGCs. There is strong interest in determining reliable metallicities and ages for such metal-poor BGCs, in particular those with a blue horizontal branch, as they are excellent candidates for the oldest native GCs of the Milky Way (Lee et al. 1994; Barbuy et al. 2006, 2018a; Dias et al. 2016), since they were born in situ. However, the number of candidates is of course quite small. We find five clusters with −1.8<[Fe/H]<− 1.4: NGC 6325, NGC 6093, NGC 6256, Terzan 4 and Terzan 9, with only NGC 6093 < −1.61. The first two could potentially be DGCs from their rather low BGC rankings, but the last three clusters appear to be very likely true BGCs. Finally, our MD exhibits two clusters at even lower metallicities, extending to [Fe/H]~ −2.5. These are NGC 6293 and VVVCL1. From its BGC ranking, NGC 6293 could be a DGC. Figure 5 also suggests this is reasonable for NGC 6293, the only cluster that is included in CAPOS, but the errors are large. However, the extreme object near −2.5, VVVCL1, ranks as a probable BGC. Neither M19 nor PV20 included this cluster, and B24 labeled it as a halo intruder, simply based on its extreme metallicity. Both Fernandez-Trincado et al. (2021b) and Olivares Carvajal et al. (2022) performed orbital analyses based on different parameters, with the former finding that the cluster is probably a halo GC while the latter prefers it as a BGC. A recent paper (Haro et al. 2025) reported both a higher probability of it actually being a DGC from a new orbital analysis, as well as a somewhat higher metallicity (around −2.25). Vasiliev & Baumgardt (2021) find it to be a BGC. In our opinion, these two extreme metallicity outliers are most likely DGCs, since the disk does include other such low metallicity clusters, and the lower metallicity limit of BGCs is ~ −1.6, slightly lower than the limit of −1.5 proposed by B16, depending of course on whether NGC 6093 is a bona fide BGC, and, if so, what its metallicity is. This is substantially lower than the minimum of ~ −1.25 suggested by the limited sample of G23.
At the metal-rich end, there are several BGCs that reach almost solar metallicity, with the two most extreme being NGC 6528 and NGC 6553, near −0.13 dex. The former in particular is a very probable BGC. A similar metal-rich tail is also seen in the other published MDs. Garro et al. (2024) find no super-solar metallicity clusters in the MW, including new clusters in their inner Galaxy sample. What about the H10 GCs with metallicities > −0.5? There are fourteen that lie towards the bulge (within 20°) and as such were considered by Zinn (1985) to compose most of his bulge/disk component, as distinguished from the halo, and have come to be synonymous with BGCs. Of these, five are classified by our method as non-BGCs, either DGC or indeterminate in versus ex situ objects, while eight are indeed in our BGC sample (GLIMPSE 2 is unclassified). Thus, the traditional Zinn B+D GCs that are indeed bonafide BGCs are <20% of our total BGC population, graphically illustrating how much our classical view of BGCs has changed recently.
A major feature of our BGC MD is the strong dominance of the −1.1 peak. Most of our sample belongs to this peak, so that, in fact, a typical BGC has a metallicity between −0.8 and −1.4 (and not around −0.5), thereby challenging our paradigm for the canonical metallicity of BGCs.
We caution here that our classification is not definitive and also that, as noted by G23 and proven by B24, the census of BGCs is still quite incomplete. Near-IR surveys like VVV/X have uncovered a large number of GC candidates in the bulge and adjacent disk in recent years (e.g., Minniti et al. 2010; Moni Bidin et al. 2011; Camargo & Minniti 2019; Palma et al. 2019; Garro et al. 2022) and some of these, on close inspection, turn out to indeed be previously unknown GCs (e.g., Dias et al. 2022). However, some turn out not to be true GCs (e.g., Gran et al. 2019; Minniti et al. 2021; G21; this paper – see Appendix A) so further work is required to definitively complete the census of BGCs. B24 indeed find no fewer than 39 new likely BGC members in their recent detailed analysis; these objects demand further investigation.
Finally, we carried out a quantitative comparison of our MD to that of bulge field stars. Following G23, we selected the recent large APOGEE sample from Rojas-Arriagada et al. (2020). They found strong evidence of trimodality, with peaks at [Fe=H]= +0.32, −0.17, and −0.66. The fraction of stars below −1 is very small, in contrast to our sample, where the main peak is more metal-poor than this. The minor BGC peak falls between the two more metal-poor field star peaks. It is unclear why the field and GC MDs are so distinct, although an age difference may be a factor. Although GCs are all “old” (i.e., >10 Gyr), we do not have very accurate ages for the field stars; however, they are likely to be somewhat younger and, thus, more metal-rich, in general. However, we would expect to see the remnants in the bulge field of stars stripped and evaporated from BGCs. We note that bulge RR Lyrae stars peak at around [Fe/H] = −1.2 (Savino et al. 2020). These stars are of similarly old ages to the GCs, so it is reassuring that their MDs peak near similar values. However, they do not show a secondary peak near −0.45. Also, the MD of 2P field stars identified in the inner Galaxy by Schiavon et al. (2017b) peaks around [Fe/H]=−1.
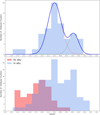 |
Fig. 7 Top: metallicity distribution (MD) for our BGC sample. The raw histogram and a smoothed fit are shown in blue, while a bimodal gaussian fit is indicated in red and green dashed curves. The BGC MD is strongly bimodal and dominated by the metal-poor peak. Bottom: MD for our in situ versus ex situ cluster samples. The in situ sample retains the bimodality displayed by the BGCs alone, while the ex situ MD is mainly unimodal. Both populations have clusters extending to the lowest metallicities, while essentially only the in situ sample has metal-rich clusters. |
7.3 Metallicity distribution of in situ versus ex situ GCs
Armed with our classification and spectroscopic metallicities of in situ B+D GCs and their accreted counterparts, it is of interest to compare their MDs. To our knowledge, such a comparison has not been made directly, although G23 plotted separately the MDs of BGCs, DGCs and halo GCs, but based on a different classification scheme. We note that only 44 of the 61 ex situ sample have metallicities in our catalog, as we required high resolution or at least CaT spectra-based metal abundances, while 78 of our 83 in situ GCs have such metallicities, so the ex situ sample is substantially less complete. The comparative lack of good metallicities for accreted GCs compared to in situ GCs is a reversal from what was the case until recently (e.g., in H10). Indeed, CAPOS has helped significantly in providing such data for previously very poorly studied objects.
Figure 7 (bottom) compares the in situ versus ex situ MDs. Interestingly, in situ GCs cover the full metallicity range, from solar to almost −2.5, while ex situ GCs are almost exclusively more metal-poor than −1. The in situ GCs show the same bimodality as the BGCs themselves; this is not surprising since the BGCs dominate, but we do note that the DGC MD alone shows the same bimodality. Ex situ GCs are more or less unimodal, with a peak around the classic halo peak of −1.6, but with a substantial number of clusters at the low metallicity end. Although the ex situ GCs dominate below ~ −1.6, in situ clusters extend to the lowest metallicity found in the ex situ sample. To first order, metallicity is a decent predictor of the origin of a GC: in situ GCs dominate above ~ −1.2, ex situ below ~ −1.6, while in the intermediate regime the probability is more equal.
7.4 [α/Fe] of in situ versus ex situ GCs
Following G21, and inspired by Horta et al. (2020), we finally investigated the mean [α/Fe] of in situ versus ex situ GCs. This ratio, as a function of [Fe/H], is sensitive to the star formation, and thus chemical enrichment, rate of a system. In a system with a shallower potential well, we would expect a lower star formation rate and thus lower [α/Fe] at a given [Fe/H], than in a system with a deeper potential. The dwarf galaxy progenitors where the accreted GCs formed presumably represent a much shallower potential than the main progenitor where the in situ GCs formed; thus, we would expect the ex situ GCs to have a lower [α/Fe] at a given [Fe/H] than their in situ counterparts of similar metallicity.
This indeed is what G21 and Horta et al. (2020) found. Both studies used Si as a proxy for the α abundance to investigate all GCs well-measured with APOGEE in DR16. G21 derived a mean [Si/Fe] for their sample of 11 in situ GCs lying between [Fe/H]=−1 to −1.5 of 0.26 ± 0.04 and 0.18 ± 0.04 for 13 accreted clusters in the same metallicity range, where there are a reasonable number of both in situ and accreted cluster types. The Horta et al. values were almost identical.
We revisit this issue, again using Si as the α proxy, not only for consistency sake but also because of its insensitivity to MP issues, which is not the case for such other possible proxies as Mg, Ca or global α. We note that this paper significantly increases the sample of observed BGCs in CAPOS and also extends them to lower metallicity than the G21 sample. Besides adding a number of new CAPOS clusters, we can also include a number of other GCs studied with APOGEE in DR17. We employ the Schiavon VAC for these clusters not in CAPOS. As a check, we find that the Schiavon [Si/Fe] values are within 0.03 dex in the mean of the corresponding CAPOS values for the 18 GCs, as expected since the database is the same.
Figure 8 shows our results. Over the entire sample of 44 in situ and 29 ex situ GCs, we find a mean < [Si/Fe] >insitu= 0.28 ± 0.06 and a mean < [Si/Fe] >exsitu= 0.24±0.09. For the sample of 17 in situ GCs with Fe abundance between −1 and −1.5, where both Horta et al. (2021) and G21 made their detailed comparison, the mean and σ are the same, while the 12 ex situ GCs in this metallicity range also have virtually the same mean (0.23) as the full sample and the same σ. Surprisingly, both the full sample as well as the limited metallicity range sample where the overlap is maximized show only a small and statistically insignificant difference in the mean Si/Fe abundances. We note that our sample size is somewhat larger than those of the previous studies. At first glance, very similar [Si/Fe] abundances at similar [Fe/H] would imply similar SFR/chemical evolution for the in situ and ex situ samples, in contrast to our expectation that the SFR should be faster in the deeper potential well of in situ versus accreted GCs, leading to higher [Si/Fe] at a given metallicity in the former. Our finding also is at odds with those of both Horta and G21, who found significant differences between in and ex situ GCs, in particular in the limited metallicity range. We also find that the GC mass is not correlated with [Si/Fe] and we note that our results do not change by using the same ex situ or in situ classifications as those adopted by G21 and Horta et al. (2020), which are very similar to ours; nor do they change significantly if we use the exact same sample as G21 and Horta but instead using our results for CAPOS GCs and S24 for other GCs.
If we take our results at face value, we need to explain why the SFRs of these two distinct GC types should be so similar. One possible explanation is that GCs, which represent the extreme high density tail of star formation, must form in very dense regions, where the local gravitational potential is indeed deep, irrespective of the more global conditions in the galaxy where the GC forms. Also, the merger and star formation histories for dwarfs at high(er) z can be quite diverse, and it may not be the case that GCs from these objects necessarily have lower [α/Fe] at a given [Fe/H] than those formed in the main progenitor.
We note that the GCs with the lowest [Si/Fe] values are all indeed ex situ. We have labeled the four most extremes cases. The most extreme is the unique GC Ruprecht 106, with a solar [Si/Fe]. Ruprecht 106 is possibly unique in another important regard – it may be the most massive GC without MPs (Villanova et al. 2013). The other three extreme cases are all Sagittarius GCs, with a mean [Si/Fe]= 0.09±0.01, very substantially lower than the other ex situ GCs. Here, we pause to consider the plausible reasons for this.
One possible explanation could be age. Theoretically, similar high [α/Fe] abundances would be expected in all GCs despite their origin if (and only if) they were all born long ago. Specifically, they would have to be born within a Gyr or so of the initial burst of relatively primordial star formation in their respective protogalaxy, after initial SNII had exploded but before any SNIa explosion had led to a decrease in [α/Fe]. It is well known that most GCs are indeed very old, of the order of 13 Gyr or more (e.g., Valcin et al. 2025). However, at least some of them are known to be somewhat younger. Thus, we would expect that GCs a Gyr or more younger than the rest might be expected to display lower [α/Fe] from subsequent SNIa ejecta into the ISM before their formation. We consider whether there is any discernible age difference between high and low [α/Fe] GCs. We look to the recent large-scale homogeneous age compilation of Valcin et al. (2025) to address this, as shown in Fig. 9. It is identical to Fig. 8 except the symbol size is now directly proportional to age instead of mass. We note that the number of CAPOS GCs is greatly decreased because their ages are poorly determined and not in the Valcin paper. There is no overall clear separation of [Si/Fe] with age – the 19 GCs older than 12 Gyr have a mean [Si/Fe]=0.27±0.06, while the 20 younger GCs have a mean [Si/Fe]=0.23±0.10, which is again only a small and statistically insignificant difference. However, the 4 extreme cases noted above are all quite young, which could explain their low [α/Fe].
A closer look reveals some potential analysis issues. Horta et al. used APOGEE ASPCAP data in DR16, while S24 used ASPCAP data in DR17. We compared these two analyses to try and understand the issue. We find that the Horta et al. mean [Si/Fe] values for 20 GCs in the limited metallicity range of interest are, on average, 0.08 dex lower than the corresponding S24 values. This might explain part of the discrepancy. However, this begs the questions of why the Horta and S24 values for the same clusters display such an offset, and why the DR16 and DR17 values might also be so different. A possible partial cause could be the S24 membership strategy that we confirmed does lead to field star contamination in some cases. However, we only found these in some of our CAPOS sample, and have not examined other GCs. A further complication is that we found BACCHUS [Si/Fe] abundances to be significantly higher than ASPCAP values for our CAPOS clusters with both analyses in hand. It is clear that more diligent works are needed to help solve these puzzles and definitively compare in situ and ex situ GCs with respect to this important diagnostic.
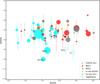 |
Fig. 8 Mean [Si/Fe] versus [Fe/H] for GCs from CAPOS (red stars), other BGCs (red circles), other DGCs (gray circles), other in situ GCs (unclassified as to whether B or D, yellow circles) and ex situ GCs (blue circles). Values for non-CAPOS clusters are from S24, except for NGC 6715 (Meszaros et al. 2020), Pal 12 (Cohen 2004), Terzan 7 (Sbordone et al. 2005) and Ruprecht 106 (Villanova et al. 2013). The symbol size is proportional to mass. We find no significant difference between in and ex situ GCs and no mass dependence. |
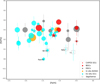 |
Fig. 9 Mean [Si/Fe] versus [Fe/H] for GCs from CAPOS (red stars), other BGCs (red circles), other DGCs (gray circles), other in situ GCs (unclassified as to whether B or D, yellow circles) and ex situ GCs (blue circles). Values for non-CAPOS clusters are from S24, except for NGC 6715 (Meszaros et al. 2020), Pal 12 (Cohen 2004), Terzan 7 (Sbordone et al. 2005), and Ruprecht 106 (Villanova et al. 2013). The symbol size is proportional to age from Valcin et al. (2025). Other than the four most extreme low [Si/Fe] GCs, which are relatively young and generally members of Sagittarius, no strong age dependence is observed. |
8 Conclusions
We present the final ASPCAP results for all 18 GCs observed in the CAPOS External Program as part of SDSS-IV, building on the initial results given by G21 for a subsample of GCs and member stars. CAPOS was designed to obtain detailed abundances and kinematics for as complete a sample of bona fide BGCs as possible, using the unique advantages of APOGEE to exploit their extraordinary Galactic archaeology attributes. We utilized ASPCAP data from DR17 to investigate atmospheric parameters, detailed abundances, and velocities for the sample.
We first carried out a stringent systematic selection of members, using the criteria of position within the tidal radius, proper motion, metallicity, radial velocity, and CMD location to ensure a very high membership probability for our final surviving targets. We found a total of 303 members with S/N>70, for a mean of almost 17 high-quality stars per cluster, along with an additional 125 stars with lower S/N. In this process, we found a good general agreement, but some discrepancies remain with respect to members selected using a similar procedure on DR17 data by Schiavon et al. (2024). Specifically, they included a number of stars that were rejected by our procedure in several clusters. Such discrepancies are to be expected given their intentionally generous membership criteria.
Following G21, we then investigated the reliability of the ASPCAP atmospheric parameters, but with our much larger sample. We reinforced and clarified the finding of G21 that stars with the highest [N/Fe] abundances within a given cluster show a higher [Fe/H] than their cluster counterparts with lower [N/Fe]. The 1P stars behave as expected, but 2P stars exhibit a roughly linear increase in [Fe/H] with [N/Fe], with the limit reasonably well defined at [N/Fe] = +0.7. Only our most metal-rich cluster does not exhibit any trend. We corrected the [Fe/H] value of 2P stars in a cluster using this trend and combined them with the uncorrected [Fe/H] values of 1P stars to derive the final cluster mean metallicity.
We also examined the behaviour of other key elements in this regard, finding that [Mg/Fe], [Ca/Fe] and [α/Fe] all exhibit significant trends with [N/Fe] for 2P stars, but that [Si/Fe] shows only a very small systematic deviation for even the most extreme 2P stars, while 1P stars are unaffected with respect to all these elements. We conclude that we can safely use the ASPCAP [Si/Fe] values for all stars but will limit our Mg, Ca, and α abundances, as well as abundances for all other elements (except Si) to 1P stars only, which should all be well determined by ASPCAP. We also decided to use Si as the best surrogate for the overall α abundance.
We then proceeded to derive mean abundances for all elements in each cluster, as well as the mean radial velocity. We then compared our values to the most relevant literature results. Our mean metallicities were determined to within 0.05 dex (mean standard deviation), our mean [α/Fe] (=[Si/Fe]) to 0.06 dex, and our mean radial velocity to 3.4 km/s. None of our clusters show any strong evidence to support internal metallicity variations, although the sample size in some clusters is relatively small, limiting the statistics. This is not the case for NGC 6656, which is the subject of a longstanding debate in the literature about a possible metallicity spread. Our sample of 130 high-S/N members in NGC 6656 shows a standard deviation in metallicity of only 0.10 dex, aligned with the finding of Meszaros et al. (2020) that is based on a much smaller sample using APOGEE and BACCHUS, who also did not support an intrinsic metallicity spread. We note that a future paper in this series will be devoted to a BACCHUS analysis of the full sample of some 250 NGC 6656 APOGEE red giant members with S/N>70 which should definitively address this issue.
Our mean metallicities are generally in good to very good agreement with previous high quality spectroscopic studies but these latter are limited due to the high extinction that most of our sample suffers. We emphasize that the near-IR, high resolution and high-S/N observations, relatively large sample sizes and excellent membership probabilities, and homogeneous abundance derivations make our CAPOS results unparalleled.
We find that our mean [Fe/H] values are within 0.05 dex but [Si/Fe] values are 0.12 dex lower than those derived for the same 11 CAPOS clusters that have been studied to date using BACCHUS and independent photometric parameters. The nature and cause of the [Si/Fe] offset will be further investigated in future papers in this series studying CAPOS clusters with BACCHUS.
Our mean radial velocities are generally in very good to excellent agreement with B19 except for Terzan 9 and NGC 6642, where we agree with G23 that the B19 values for these two GCs are highly suspect. A check on the new DR3 values for these two GCs shows that the discrepancy is now gone. We find good general agreement between our bulge cluster and field star samples for both Mn and Ni.
To optimally explore the most salient implications of CAPOS, we first assessed the nature of our sample with regards to both in situ versus ex situ status as well as classification of in situ GCs as either GB or GD members, to ensure the cleanest sample of genuine BGCs as possible. We derived a new chemo-dynamical classification scheme for all Galactic GCs, synthesizing the results of a number of recent classification studies. Slightly more than half of the 163 GCs we studied are classified as in situ. Forty of these are deemed BGCs, which matches very well with other recent assessments. However, we note that our list is undoubtedly incomplete as we do not investigate any of the 39 new BGC clusters and candidates recently compiled by B24. All but four of our CAPOS sample are classified as BGCs. We also compile an up-to-date list of modern, high-quality mean metal abundances (using APOGEE values when available) or other high resolution spectroscopic studies or finally CaT measures if no high resolution value was available.
We first investigated the MD of our BGCs. As in other similar recent studies, the BGC MD is strongly bimodal, with peaks near −1.1 and −0.45. The latter is the one traditionally associated with BGCs; however, not only is there a second, more metal-poor peak, but it is in fact the dominant one, containing >70% of all BGCs. A short tail extends from the higher metallicity peak up to near solar, and a longer tail extends to much lower metallicity than the metal-poor peak. We suggest that the lower metallicity limit is near −1.6, and that the two “BGCs” we found at much lower metallicity, NGC 6293 and VVVCL001, are most likely DGCs. Improved distances and orbits for these clusters is required to determine their true nature. The latter object is a particularly intriguing GC, with a mean metallicity of ~ −2.25 (Haro et al. 2025); thus, it is likely the most metal-poor and potentially also the oldest in situ GC in the MW, with the possibility of a metallicity spread (Haro et al. 2025). More high-resolution NIR spectra are required to pin down its mean metallicity, potential spread and radial velocity, as well as deep near-IR photometry to derive the age for this possibly oldest main progenitor GC. Our group is working on all of these key goals.
We next compare the MD of in versus ex situ GCs. The in situ GCs show the same bimodality as the BGCs themselves, while the ex situ GCs are more or less unimodal, with a peak around the classic halo peak of −1.6, but with a substantial number of clusters at the low metallicity end. To first order, metallicity is a decent predictor of the origin of a GC: in situ GCs dominate above ~ −1.2, ex situ below ~ −1.6, while in the intermediate regime the probability is roughly equal.
Finally, we investigate the mean [α/Fe] of in situ versus ex situ GCs. Theoretically, we would expect the ex situ GCs to have a lower [α/Fe] at a given [Fe/H] than their in situ counterparts of similar metallicity, given their likely origin in dwarf galaxies with shallower potential wells and thus lower star formation rates compared to the main progenitor, which has been confirmed by several previous studies, including G21. Here, as in the previous studies, we used [Si/Fe] as the best proxy for [α/Fe]. We note that this paper significantly increases the sample of observed BGCs in CAPOS, now using all of the CAPOS observations and DR17, and also extends them to lower metallicity than the G21 sample. Surprisingly, we find only a small and statistically insignificant difference in the mean [Si/Fe] abundances of in situ and ex situ GCs. We point out possible theoretical explanations for this; for instance, younger ages, at least for the lowest [Si/Fe] clusters, which are also ex situ and mostly in Sagittarius. However, we find no strong correlation (while we also find some inconsistencies in various analyses of [Si/Fe] abundances) and, thus, we urge further careful analyses with as homogeneous a sample as possible to clarify this conundrum.
In the appendix, we show that all three of the Minni candidate GCs observed by CAPOS display no clustering in either proper motion, CMD, or metallicity-radial velocity space. Therefore, they are not star clusters.
For the near future, we note that all of our CAPOS clusters are being analyzed with the BACCHUS package using independent photometric atmospheric parameters to mitigate ASPCAP issues with 2P stars, which are prevalent in our sample. We also note the ongoing SDSS-V Open Fiber project, aimed at observing all the remaining BGCs not observed by APOGEE in SDSS-III or SDSS-IV to extend CAPOS and obtain a complete sample.
Data availability
The final CAPOS cluster members is available at the CDS via https://cdsarc.cds.unistra.fr/viz-bin/cat/J/A+A/703/A267.
Acknowledgements
We would like to warmly acknowledge SDSS-IV and especially all of those who have contributed to the outstanding success of both APOGEE North and South. The referee, Ricardo Schiavon, provided a very detailed and in-depth report which greatly improved this paper. D.G. and S.V. gratefully acknowledge the support provided by Fondecyt regular no. 1220264. D.G. also acknowledges financial support from the Dirección de Investigación y Desarrollo de la Universidad de La Serena through the Programa de Incentivo a la Investigación de Académicos (PIA-DIDULS), as well as the moral and amorous support of M.E. Barraza. C.M. thanks the support provided by ANID-GEMINI Postdoctorado No.32230017. D.M. acknowledges support from the Center for Astrophysics and Associated Technologies CATA by the ANID BASAL projects ACE210002 and FB210003, and by Fondecyt Project No. 1220724. A.M. acknowledges support from the FONDECYT Regular grant 1212046, from the ANID BASAL project FB210003, as well as funding from the HORIZON-MSCA-2021-SE-01 Research and Innovation Programme under the Marie Sklodowska-Curie grant agreement number 101086388. C. Montecinos is supported by the National Agency for Research and Development (ANID) through Programa Nacional de Becas de Doctorado (DOCTORADO BECAS CHILE/2022 – 21220138). A.M.K. acknowledges support from grant AST-2009836 and AST02408324 from the National Science Foundation. This work has made use of data from the European Space Agency (ESA) mission Gaia (https://www.cosmos.esa.int/gaia), processed by the Gaia Data Processing and Analysis Consortium (DPAC, https://www.cosmos.esa.int/web/gaia/dpac/consortium). Funding for the DPAC has been provided by national institutions, in particular the institutions participating in the Gaia Multilateral Agreement. Based on observations obtained through the Chilean National Telescope Allocation Committee through programs CN2017B-37, CN2018A-20, CN2018B-46, CN2019A-98 and CN2019B-31.
References
- Abdurro’uf, A., Aerts, C., Silva, A., et al. 2022, ApJS, 259, 35 [NASA ADS] [CrossRef] [Google Scholar]
- Ahumada, R., Allende Prieto, C., Almeida, A., et al. 2020, ApJS, 249, 3 [NASA ADS] [CrossRef] [Google Scholar]
- Arentsen, A., Starkenburg, E., Martin, N. F., et al. 2020, MNRAS, 496, 4964 [NASA ADS] [CrossRef] [Google Scholar]
- Bailin, J. 2019, ApJS, 245, 5 [NASA ADS] [CrossRef] [Google Scholar]
- Barbá, R., Minniti, D., Geisler, D., et al. 2019, ApJ, 870L, 24B [Google Scholar]
- Barbuy, B., Zoccali, M., Ortolani, S., et al. 2006, A&A, 449, 349 [NASA ADS] [CrossRef] [EDP Sciences] [Google Scholar]
- Barbuy, B., Zoccali, M., Ortolani, S., et al. 2007, AJ, 134, 1613 [Google Scholar]
- Barbuy, B., Cantelli, E., Vemado, A., et al. 2016, A&A, 591, A53 [NASA ADS] [CrossRef] [EDP Sciences] [Google Scholar]
- Barbuy, B., Chiappini, C., & Gerhard, O. 2018a, ARA&A, 56, 223 [Google Scholar]
- Barbuy, B., Muniz, L., Ortolani, S., et al. 2018b, A&A, 619, 178 [Google Scholar]
- Barbuy, B., Cantelli, E., Muniz, L., et al. 2021, A&A, 654, 29 [Google Scholar]
- Barrera, N., Villanova, S., Geisler, D., et al. 2025, A&A, 699, 128 [Google Scholar]
- Bastian, N., & Lardo, C. 2018, ARA&A 56, 83 [Google Scholar]
- Baumgardt, H., Hilker, M., Sollima, A., et al. 2019, MNRAS, 482, 5138 [NASA ADS] [CrossRef] [Google Scholar]
- Belokurov, V., & Kravtsov, A. 2023, MNRAS, 525, 4456 [NASA ADS] [CrossRef] [Google Scholar]
- Belokurov, V., & Kravtsov, A. 2024, MNRAS, 528, 3198 [CrossRef] [Google Scholar]
- Bica, E., Ortolani, S., & Barbuy, B. 2016, PASA, 33, 28 [Google Scholar]
- Bica, E., Ortolani, S., Barbuy, B., et al. 2024, A&A, 687, 201 [Google Scholar]
- Blanton, M. R., Bershady, M. A., Abolfathi, B., et al. 2017, AJ, 154, 28 [Google Scholar]
- Bowen, I., & Vaughan, A. 1973, Appl. Opt., 12, 1430 [Google Scholar]
- Callingham, T., Cautun, M., Deason, A., et al. 2022, MNRAS, 513, 4107 [NASA ADS] [CrossRef] [Google Scholar]
- Camargo, D., & Minniti, D. 2019, MNRAS, 484, L90 [Google Scholar]
- Cantat-Gaudin, T., Jordi, C., Vallenari, A., et al. 2018, A&A, 618, A93 [NASA ADS] [CrossRef] [EDP Sciences] [Google Scholar]
- Carretta, E., Bragaglia, A., Gratton, R. G., et al. 2009, A&A, 505, 117 [NASA ADS] [CrossRef] [EDP Sciences] [Google Scholar]
- Chen, Y., & Gnedin, O. 2024, OJAp, 7, 23 [Google Scholar]
- Cohen, J. G., 2004, AJ, 127, 1545 [NASA ADS] [CrossRef] [Google Scholar]
- Crestani, J., Alves-Brito, A., Bono, G., et al. 2019, MNRAS, 487, 5463 [Google Scholar]
- Dias, B., Barbuy, B., Saviane, I., et al. 2016, A&A, 590, 9 [Google Scholar]
- Dias, B., Palma, T., Minniti, D., et al. 2022, A&A, 657, A67 [NASA ADS] [CrossRef] [EDP Sciences] [Google Scholar]
- Ernandes, H., Barbuy, B., Friaca, A., et al. 2020, A&A, 640, 89 [Google Scholar]
- Fanelli, C., Origlia, L., Rich, R. M., et al. 2024, A&A, 690, 639 [Google Scholar]
- Fernandez-Trincado, J., Beers, T., Barbuy, B., et al. 2021a, ApJ, 918, L9 [Google Scholar]
- Fernandez-Trincado, J., Minniti, D., Souza, S., et al. 2021b, ApJ, 908, 42 [Google Scholar]
- Fernandez-Trincado, J., Villanova, S., Geisler, D., et al. 2022, A&A, 658, 116 [Google Scholar]
- Frelijj, H., Gonzalez-Diaz, D., Geisler, D., et al. 2025, A&A, 701, A159 [NASA ADS] [CrossRef] [EDP Sciences] [Google Scholar]
- Gargiulo, I., Monachesi, A., Gómez, F., et al. 2019, MNRAS, 489, 5742 [Google Scholar]
- García Pérez, A. E., Allende Prieto, C., Holtzman, J. A., et al. 2016, AJ, 151, 144 [Google Scholar]
- Garro, E., Minniti, D., Alessi, B., et al. 2022, A&A, 659, A155 [NASA ADS] [CrossRef] [EDP Sciences] [Google Scholar]
- Garro, E., Minniti, D., & Fernandez-Trincado, J. 2024, A&A, 687, 214 [Google Scholar]
- Geisler, D., Villanova, S., O’Connell, J., et al. 2021, A&A, 652, 157 [Google Scholar]
- Geisler, D., Parisi, M., Dias, B., et al. 2023, A&A, 669, 115 [Google Scholar]
- Gonzalez-Diaz, D., Fernandez-Trincado, J., Villanova, S., et al. 2023, MNRAS, 526, 6274 [CrossRef] [Google Scholar]
- Gran, F., Zoccali, M., Contreras Ramos, R., et al. 2019, A&A, 628, A45 [NASA ADS] [CrossRef] [EDP Sciences] [Google Scholar]
- Haro, W., Moni Bidin, C., Parisi, M. C., et al. 2025, A&A, submitted [Google Scholar]
- Harris, W. E. 1996, AJ, 112, 1487 [Google Scholar]
- Haydenu M. R., Bovy, J., Holtzman, J. A., Nidever, D. L., et al. 2015, ApJ, 808, 132 [Google Scholar]
- Hayes, C., Masseron, T., Sobeck, J., et al. 2022, ApJS, 262, 34 [NASA ADS] [CrossRef] [Google Scholar]
- Henao, L., Villanova, S., Geisler, D., et al. 2025, A&A, 696, A154 [NASA ADS] [CrossRef] [EDP Sciences] [Google Scholar]
- Horta, D., Schiavon, R., Mackereth, J., et al. 2020, MNRAS, 493, 3363 [NASA ADS] [CrossRef] [Google Scholar]
- Horta, D., Schiavon, R. P., Mackereth, J. T., et al. 2021, MNRAS, 500, 1385 [Google Scholar]
- Howes, L. M., Asplund, M., Keller, S. C., et al. 2016, MNRAS, 460, 884 [NASA ADS] [CrossRef] [Google Scholar]
- Huang, R., Tang, B., Li, C., et al. 2024, SCPMA, 67, 259513 [Google Scholar]
- Johnson, C., Rich, R., Pilachowski, C., et al. 2015, AJ, 150, 63 [NASA ADS] [CrossRef] [Google Scholar]
- Johnson, C., Caldwell, N., Rich, R., et al. 2016, AJ, 152, 21 [NASA ADS] [CrossRef] [Google Scholar]
- Johnson, C., Caldwell, N., Rich, R., et al. 2017, ApJ, 836, 168 [NASA ADS] [CrossRef] [Google Scholar]
- Johnson, C., Rich, R., Caldwell, N., et al. 2018, AJ, 155, 71 [Google Scholar]
- Jönsson, H., Allende Prieto, C., Holtzman, J., et al. 2018, AJ, 156, 126 [Google Scholar]
- Jönsson, H., Holtzman, J., Allende Prieto, C., et al. 2020, AJ, 160, 120 [Google Scholar]
- Kinman, T. 1959, MNRAS, 119, 538 [NASA ADS] [CrossRef] [Google Scholar]
- Koch, A.; Hansen, C., & Kunder, A. 2017, A&A, 604, 41 [Google Scholar]
- Kruijssen, J. M. D., Pfeffer, J. L., Reina-Campos, M., et al. 2019, MNRAS, 486, 3180 [NASA ADS] [CrossRef] [Google Scholar]
- Kunder, A., & Butler, E. 2020, AJ, 160, 241 [NASA ADS] [CrossRef] [Google Scholar]
- Lee, Y.-W., Demarque, P., & Zinn, R. 1994, ApJ, 423, 248 [NASA ADS] [CrossRef] [Google Scholar]
- Majewski, S., Schiavon, R., Frinchaboy, P., et al. 2017, AJ, 154, 94 [NASA ADS] [CrossRef] [Google Scholar]
- Marino, A., Sneden, C., Kraft, R., et al. 2011, A&A, 532, 8 [Google Scholar]
- Massari, D., Koppelmann, H., & Helmi, A. 2019, A&A, 630, L4 [NASA ADS] [CrossRef] [EDP Sciences] [Google Scholar]
- Masseron, T., Merle, T., & Hawkins, K. 2016, BACCHUS: Brussels Automatic Code for Characterizing High accUracy Spectra [Astrophysics Source Code Library] [Google Scholar]
- McKenzie, M., Yong, D., Marino, A., et al. 2022, MNRAS, 516, 3515 [NASA ADS] [CrossRef] [Google Scholar]
- Meszaros, S., Masseron, T., García Hernández, D. A., et al. 2020, MNRAS, 492, 1641 [Google Scholar]
- Minniti, D., 1995, AJ, 109, 1663 [NASA ADS] [CrossRef] [Google Scholar]
- Minniti, D., Alonso-García, J., Braga, V., et al. 2017a, RNAAS, 1, 16 [Google Scholar]
- Minniti, D., Geisler, D., Alonso-García, J., et al. 2017b, ApJ, 849, L24 [Google Scholar]
- Minniti D., Alonso-García, J., Braga, V., Contreras Ramos, R., et al. 2017c, RNAAS, 1, 16 [Google Scholar]
- Minniti, D., Alonso-García, J., & Pullen, J. 2017d, RNAAS, 1, 54. [Google Scholar]
- Minniti, D., Dias B., Gómez, M., Palma, T., & Pullen, J. B. 2019, ApJ, 884, L15 [Google Scholar]
- Minniti, D., Lucas, P. W., Emerson, J. P., et al. 2010, New Astron., 15, 433 [Google Scholar]
- Minniti, D., Palma, T., & Claria, J. 2021, Bol. Asoc. Argentina Astron. Plata Argentina, 62, 107 [Google Scholar]
- Moni Bidin, C., Mauro, F., Geisler, D., et al. 2011, A&A, 535, 33 [Google Scholar]
- Montecinos, C., Geisler, D., Muñoz, C., & Villanova, S. 2025, A&A, submitted [NASA ADS] [CrossRef] [EDP Sciences] [Google Scholar]
- Morgan, W. 1959, AJ, 64, 432 [Google Scholar]
- Mucciarelli, A., Lapenna, E., Massari, D., et al. 2015, ApJ, 809, 128 [NASA ADS] [CrossRef] [Google Scholar]
- Muñoz, C., Villanova, S., Geisler, D., et al. 2017, A&A, 605, 12 [Google Scholar]
- Muñoz, C., Geisler, D., Villanova, S., et al. 2018, A&A, 620, A96 [Google Scholar]
- Muñoz, C., Geisler, D., Villanova, S., et al. 2021, MNRAS, 506, 4676 [CrossRef] [Google Scholar]
- Muñoz, C., Monachesi, A., Nidever, D. L., et al. 2023, A&A, 680, A79 [Google Scholar]
- Nidever, D. L., Hasselquist, S., Hayes, C. R., et al. 2020, ApJ, 895, 88 [Google Scholar]
- Norris, J., & Freeman, K. C. 1983, ApJ, 266, 130 [NASA ADS] [CrossRef] [Google Scholar]
- Olivares Carvajal, J., Zoccali, M., Rojas-Arriagada, A., et al. 2022, MNRAS, 513, 3993 [NASA ADS] [CrossRef] [Google Scholar]
- Origlia, L., & Rich, R. M. 2004, AJ, 127, 3422 [Google Scholar]
- Origlia, L., Massari, D., Rich, R. M., et al. 2013, ApJ, 779, 50 [NASA ADS] [CrossRef] [Google Scholar]
- Pagnini, G., Di Matteo, P., Khoperskov, S., et al. 2023, A&A, 673, 86 [Google Scholar]
- Palma, T., Minniti, D., Alonso-García, J., et al. 2019, MNRAS, 487, 3140 [Google Scholar]
- Pérez-Villegas, A., Barbuy, B., Kerber, L. O., et al. 2020, MNRAS, 491, 3251 [Google Scholar]
- Pfeffer, J., Lardo, C., Bastian, N., et al. 2021, MNRAS, 500, 2514 [Google Scholar]
- Pino-Zuniga, T., Villanova, S., Geisler, D., et al. 2025, A&A, submitted [Google Scholar]
- Rojas-Arriagada, A., Zasowski, G., Schultheis, M., et al. 2020, MNRAS, 499, 1037 [Google Scholar]
- Romero-Colmenares, M., Fernandez-Trincado, J., Geisler, D., et al. 2021, A&A, 652, 158 [Google Scholar]
- Rutledge, G., Hesser, J., & Stetson, P. 1997, PASP, 109, 907 [Google Scholar]
- Savino, A., Koch, A., Prudil, Z., et al. 2020, A&A, 641, 96 [Google Scholar]
- Sbordone, L., Bonifacio, P., Marconi, G., Buonanno, R., & Zaggia, S. 2005, A&A, 437, 905 [NASA ADS] [CrossRef] [EDP Sciences] [Google Scholar]
- Schiavon, R., Johnson, J. A., Frinchaboy, P. M., et al. 2017a, MNRAS, 466, 2010 [Google Scholar]
- Schiavon, R., Zamora, O., Carrera, R., et al. 2017b, MNRAS, 465, 501 [Google Scholar]
- Schiavon, R., Phillips, S., Myers, N., et al. 2024, MNRAS, 528, 1393 [CrossRef] [Google Scholar]
- Souza, S., Ernandes, H., Valentini, M., et al. 2023, A&A, 671, 45 [Google Scholar]
- Stello, D., Zinn, J., & Elsworth, Y. 2017, ApJ, 835, 83 [NASA ADS] [CrossRef] [Google Scholar]
- Taylor, D. J., Mason, A.C., Schiavon, R. P., et al. 2022, MNRAS, 513, 3429 [NASA ADS] [CrossRef] [Google Scholar]
- Tumlinson, J. 2010, ApJ, 708, 1398 [CrossRef] [Google Scholar]
- Uribe, M., Villanova, S., Geisler, D., et al. 2025, A&A, in press, https://doi.org/10.1051/0004-6361/202556084 [Google Scholar]
- Valcin D., Jimenez, R., Seljak, U., & Verde, L. 2025, J. Cosmol. Astropart. Phys., 2025, 030 [Google Scholar]
- Valenti, E., Origlia, L., & Rich, R. 2011, MNRAS, 414, 2690 [NASA ADS] [CrossRef] [Google Scholar]
- Valenti, E., Origlia, L., Mucciarelli, A., et al. 2015, A&A, 574, 80 [Google Scholar]
- Vasiliev, E., & Baumgardt, H. 2021, MNRAS, 505, 5978 [NASA ADS] [CrossRef] [Google Scholar]
- Vasini, A., Spitoni, E., & Matteucci, F. 2024, A&A, 683, 121 [Google Scholar]
- Vasquez, S., Saviane, I., Held, E. V., et al. 2018, A&A, 618, 13 [Google Scholar]
- Villanova, S., Geisler, D., Carraro, G., et al. 2013, ApJ, 778, 186 [Google Scholar]
- Villanova, S., Moni Bidin, C., Mauro, F., et al. 2017, MNRAS, 464, 2730 [Google Scholar]
- Villanova, S., Monaco, L., Geisler, D., et al. 2019, ApJ, 882, 174 [NASA ADS] [CrossRef] [Google Scholar]
- Wilson, J., Hearty, F., & Skrutskie, M. 2019, PASP, 131, 50001 [Google Scholar]
- Zinn, R. 1985, ApJ, 293, 424 [Google Scholar]
Appendix A Investigating the reality of Minni candidate globular clusters
As noted in G21, CAPOS also targeted any recently discovered BGC candidates that could be observed serendipitously simultaneously with cataloged BGCs, given the large field of view of APOGEE, as supplemental targets after all fibers that could be placed on known BGC stars have been assigned. We present here our investigation of the three such candidates we observed, finding that none of them are bonafide clusters.
Appropriate targets satisfying the above were taken from the list of candidate GCs found in the VVV survey by Minniti et al (2017b) and Palma et al. (2019). These are referred to as Minni candidates. We were able to include one candidate in each of three CAPOS fields: Minni 6 in field 000-06, Minni 51 in field 003-03 and Minni 66 in field 350-03. The number of spectra obtained varied due to the nature of the field, how many other known GCs were included, etc. In the end, we were able to obtain good spectra for 46 stars in the field of Minni 06 with S/N between 75 to 360,15 in Minni 51 with S/N between 8 to 378 but only 4 in Minni 66 with S/N between 64 to 194.
To assess the possible cluster nature of the candidates, we selected stars using the coordinates and radius listed in Minniti et al. (2019, 2017c, 2017d) and compared the selected stars using these criteria with different values of proper motion, RV, metallicity, and color, as well as with field stars.
Figures 1–3 show our results. We find no clustering in proper motion, CMD, or metallicity-RV space for any of these candidates; thus, there is no evidence to support classifying them as clusters. We note that G21 investigated a smaller sample in Minni 51 and arrived at the same conclusion.
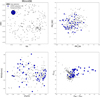 |
Fig. A.1 Analysis of the possibility that Minni 6 is a real cluster. Parameters are the same as in Figure 1. No clustering is found for the PM, RV, metallicity, or CMD space. |
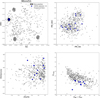 |
Fig. A.2 As above for Minni 51. |
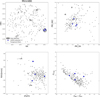 |
Fig. A.3 As above for Minni 66. |
All Tables
All Figures
|
Fig. 1 Membership determination in NGC 6380, including location with respect to tidal radius (top-left), PM space (upper right), metallicity-RV space (lower left), and CMD (bottom-right). CAPOS final members are shown in blue, with boxes around those with S/N<70, non-CAPOS members in yellow, and other stars observed by APOGEE in grey. The Vasiliev & Baumgardt (2021) mean RV and error are shown in cyan. The clustering seen in the grey points are due to two other GCs observed in the same CAPOS field. |
| In the text | |
|
Fig. 2 Comparison of our membership determination in NGC 6380 to that of S24. Diagrams and point descriptions as in Figure 1, but with yellow points indicating members selected by S24, and green pentagons showing duplications in their selection. The typical error in PM is about 0.01 mas yr−1 for both pmRa and pmDec, and in the RV versus metallicity plot, typical errors are shown in red. S24 included a number of stars that do not satisfy our more stringent membership requirements. |
| In the text | |
|
Fig. 3 (a) Δ([Fe/H]) (difference in [Fe/H] from the mean based on only 1P stars = those with ([N/Fe]<0.7) as a function of [N/Fe]. A clear trend is found for 2P (higher [N/Fe]) stars to have a higher [Fe/H] than 1P stars in the same cluster, with the difference in metallicity increasing with increasing [N/Fe] for 2P stars. The best-fit line is shown for 2P stars. (b) As in a) but for [Mg/Fe]. (c) As in a) but for [Si/Fe]. (d) As in a) but for [Ca/Fe]. The stars are color-coded according to metallicity in each panel. |
| In the text | |
|
Fig. 4 Mean abundance ratio of the Fe-peak elements Mn (top) and Ni (bottom) for each of our clusters (filled blue circles with error bars), compared with APOGEE bulge stars (asterisks – Rojas-Arriagada et al. 2020) and the general trend of disk stars (circles – Hayden et al. 2015). Our BGCs generally follow the bulge field-star trend but extend to lower metallicity. |
| In the text | |
|
Fig. 5 Mean [Mg/Mn] versus [Al/Fe] for CAPOS clusters. We include the purported division between various origins from Horta et al. (2021). |
| In the text | |
|
Fig. 6 Mean [Mg/Fe] versus [Al/Fe] for CAPOS clusters. We include the purported division between accreted and in situ clusters from BK24. |
| In the text | |
|
Fig. 7 Top: metallicity distribution (MD) for our BGC sample. The raw histogram and a smoothed fit are shown in blue, while a bimodal gaussian fit is indicated in red and green dashed curves. The BGC MD is strongly bimodal and dominated by the metal-poor peak. Bottom: MD for our in situ versus ex situ cluster samples. The in situ sample retains the bimodality displayed by the BGCs alone, while the ex situ MD is mainly unimodal. Both populations have clusters extending to the lowest metallicities, while essentially only the in situ sample has metal-rich clusters. |
| In the text | |
|
Fig. 8 Mean [Si/Fe] versus [Fe/H] for GCs from CAPOS (red stars), other BGCs (red circles), other DGCs (gray circles), other in situ GCs (unclassified as to whether B or D, yellow circles) and ex situ GCs (blue circles). Values for non-CAPOS clusters are from S24, except for NGC 6715 (Meszaros et al. 2020), Pal 12 (Cohen 2004), Terzan 7 (Sbordone et al. 2005) and Ruprecht 106 (Villanova et al. 2013). The symbol size is proportional to mass. We find no significant difference between in and ex situ GCs and no mass dependence. |
| In the text | |
|
Fig. 9 Mean [Si/Fe] versus [Fe/H] for GCs from CAPOS (red stars), other BGCs (red circles), other DGCs (gray circles), other in situ GCs (unclassified as to whether B or D, yellow circles) and ex situ GCs (blue circles). Values for non-CAPOS clusters are from S24, except for NGC 6715 (Meszaros et al. 2020), Pal 12 (Cohen 2004), Terzan 7 (Sbordone et al. 2005), and Ruprecht 106 (Villanova et al. 2013). The symbol size is proportional to age from Valcin et al. (2025). Other than the four most extreme low [Si/Fe] GCs, which are relatively young and generally members of Sagittarius, no strong age dependence is observed. |
| In the text | |
|
Fig. A.1 Analysis of the possibility that Minni 6 is a real cluster. Parameters are the same as in Figure 1. No clustering is found for the PM, RV, metallicity, or CMD space. |
| In the text | |
|
Fig. A.2 As above for Minni 51. |
| In the text | |
|
Fig. A.3 As above for Minni 66. |
| In the text | |
Current usage metrics show cumulative count of Article Views (full-text article views including HTML views, PDF and ePub downloads, according to the available data) and Abstracts Views on Vision4Press platform.
Data correspond to usage on the plateform after 2015. The current usage metrics is available 48-96 hours after online publication and is updated daily on week days.
Initial download of the metrics may take a while.