Open Access
Fig. 4
Download original image
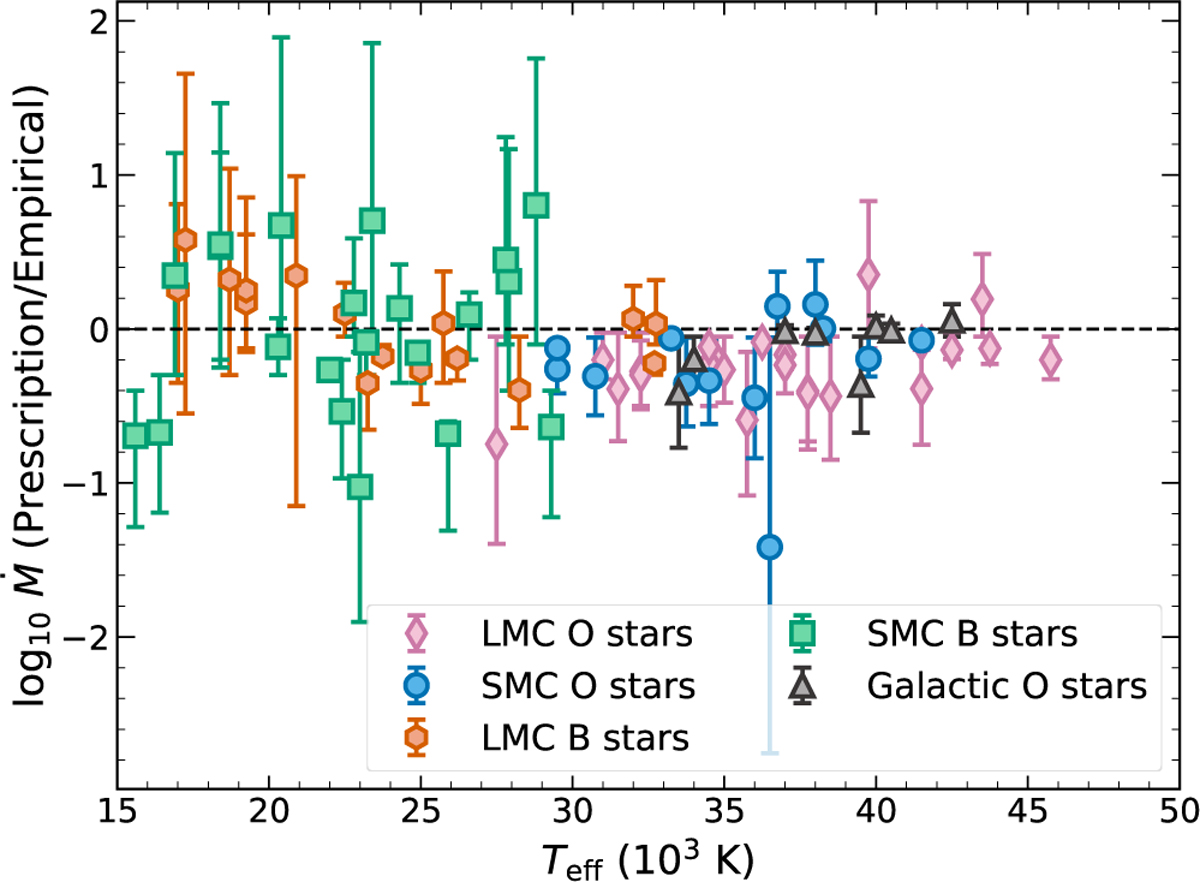
Logarithm of the ratio between mass-loss rates derived using our method and rates obtained empirically from observational data as described in the text. The colors and markers correspond to the different samples marked on the labels. The dashed line illustrates the position where rates would be equal.
Current usage metrics show cumulative count of Article Views (full-text article views including HTML views, PDF and ePub downloads, according to the available data) and Abstracts Views on Vision4Press platform.
Data correspond to usage on the plateform after 2015. The current usage metrics is available 48-96 hours after online publication and is updated daily on week days.
Initial download of the metrics may take a while.