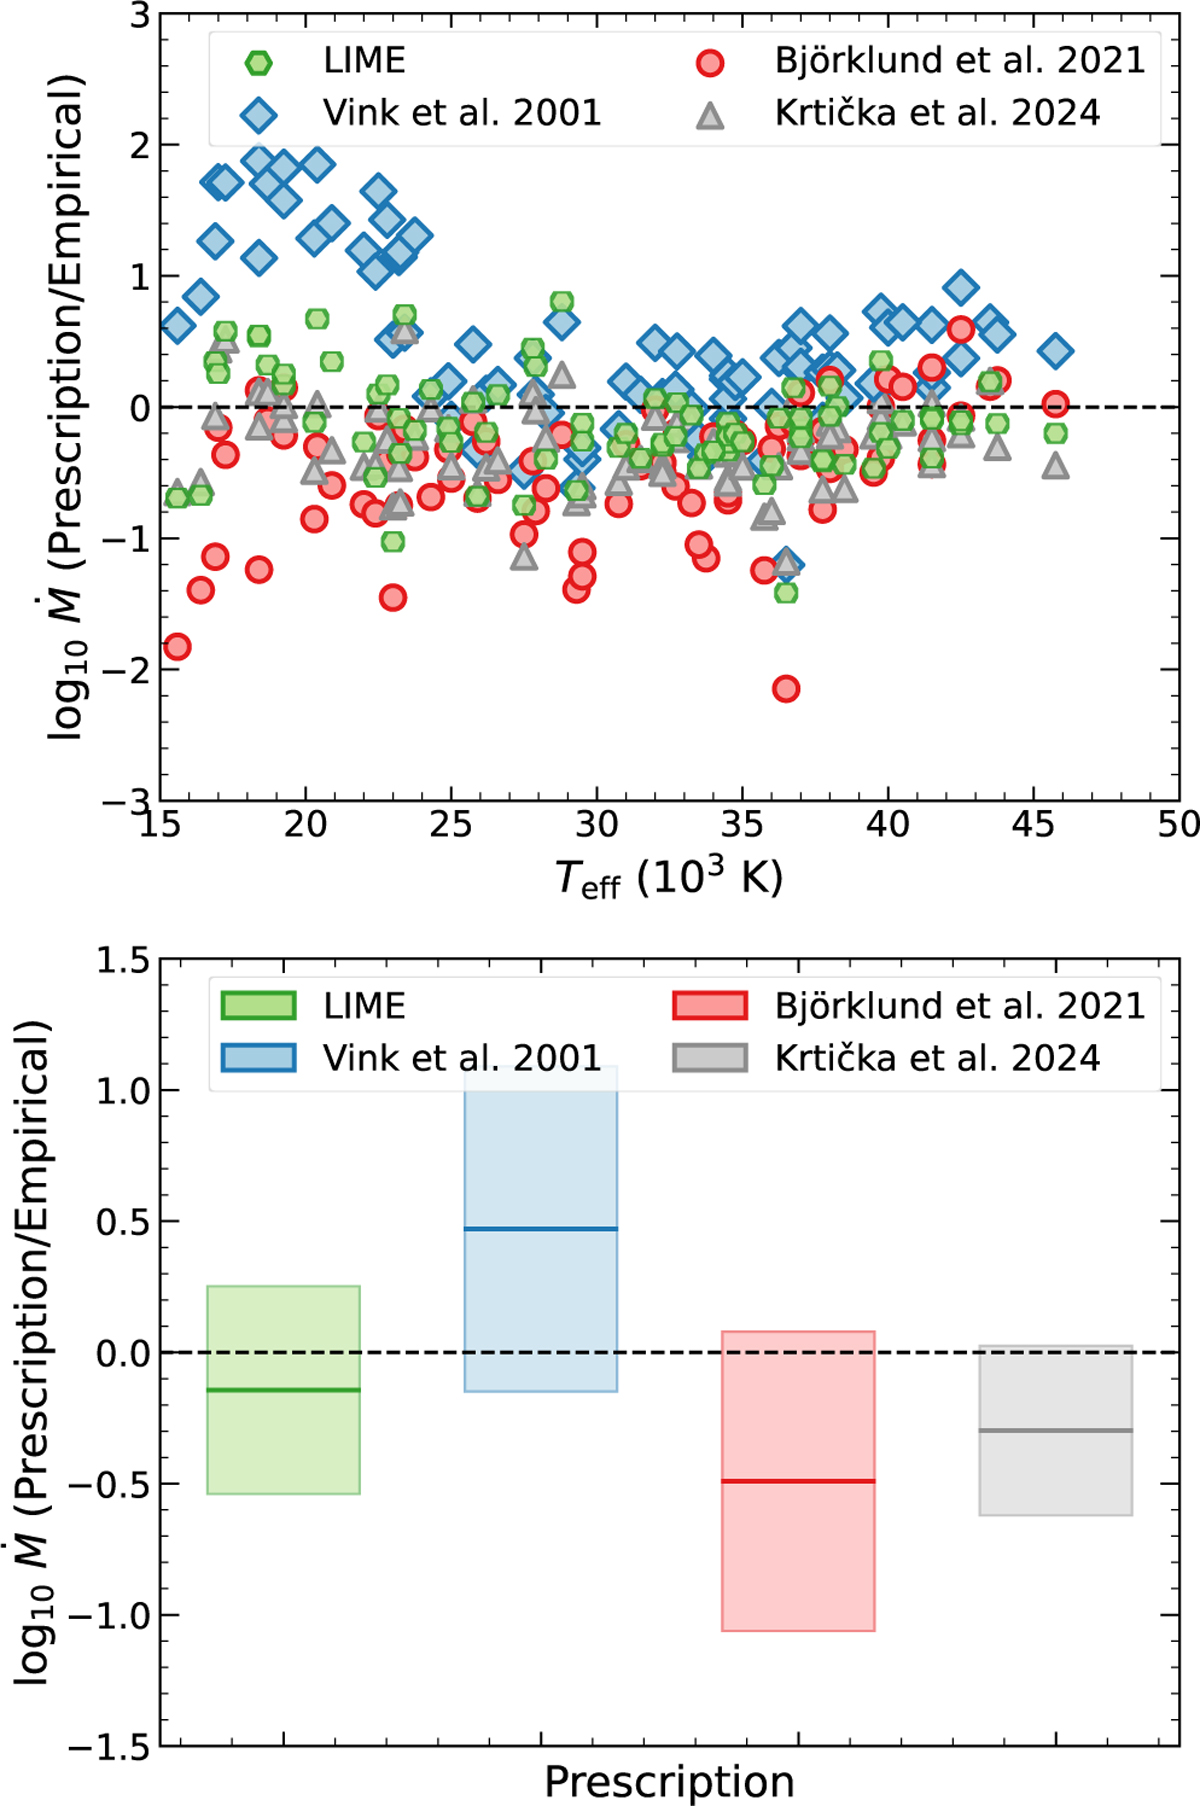
Fig. 5
Download original image
Top panel: same as Fig. 4, but also comparing the observations with theoretical rates computed by different methods, as indicated in the labels. For clarity, error margins for empirical rates are omitted. Bottom panel: sample averages and one standard deviation for the four methods. The dashed black line indicates where rates are equal.
Current usage metrics show cumulative count of Article Views (full-text article views including HTML views, PDF and ePub downloads, according to the available data) and Abstracts Views on Vision4Press platform.
Data correspond to usage on the plateform after 2015. The current usage metrics is available 48-96 hours after online publication and is updated daily on week days.
Initial download of the metrics may take a while.