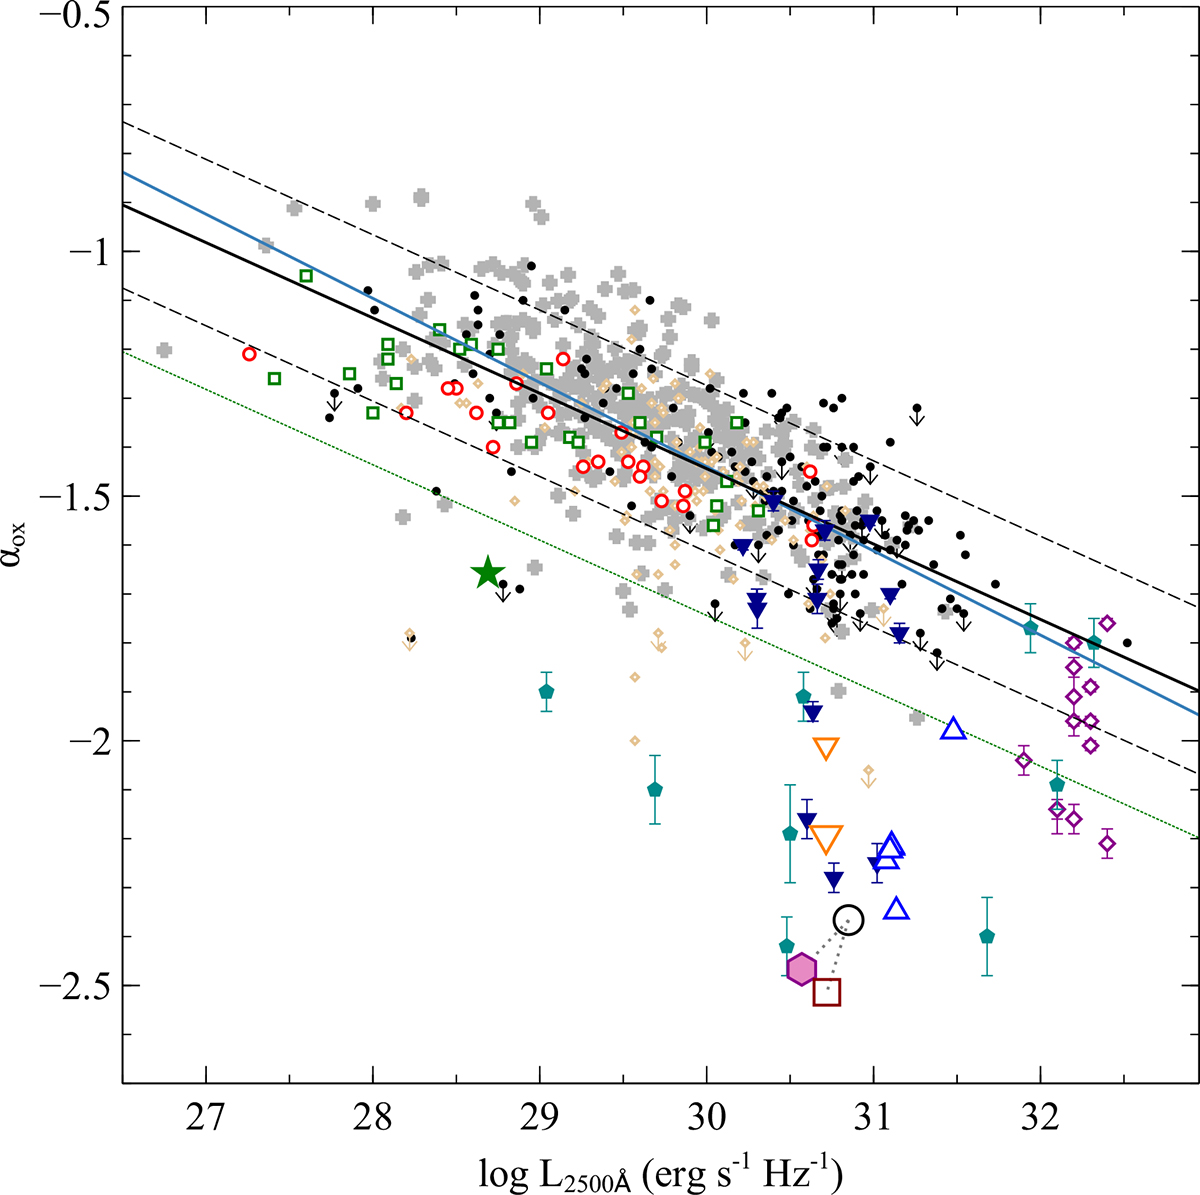
Fig. 11.
Download original image
αox gradient as function of monochromatic luminosity at rest frame 2500 Å. Black dots mark the SDSS objects from Strateva et al. (2005), while gray filled circles mark the data from Steffen et al. (2006). Further measurements of extreme X-ray weak quasars are indicated by cyan pentagons (Saez et al. 2012), blue and yellow open triangles (Schartel et al. 2010, 2007; Ballo et al. 2011), dark blue filled triangles (Laurenti et al. 2022), and magenta open diamonds (Zappacosta et al. 2020). The positions of PG 0043+039 are highlighted for the years 2005 (red square), 2013 (black circle), and 2022 (filled purple hexagon). The solid black line gives the best-fit relation from Lusso et al. (2010) with the 1σ spread (dashed lines) (see Fig. 5 in Laurenti et al. 2022). The blue line is the best-fit relation from Martocchia et al. (2017). The solid green line marks the line for X-ray weakness (Pu et al. 2020).
Current usage metrics show cumulative count of Article Views (full-text article views including HTML views, PDF and ePub downloads, according to the available data) and Abstracts Views on Vision4Press platform.
Data correspond to usage on the plateform after 2015. The current usage metrics is available 48-96 hours after online publication and is updated daily on week days.
Initial download of the metrics may take a while.