| Issue |
A&A
Volume 703, November 2025
|
|
|---|---|---|
| Article Number | A108 | |
| Number of page(s) | 16 | |
| Section | Extragalactic astronomy | |
| DOI | https://doi.org/10.1051/0004-6361/202554958 | |
| Published online | 13 November 2025 | |
Multiwavelength continuum, emission line and BAL variability with prominent P V absorption in the X-ray-weakest quasar PG 0043+039⋆
1
Institut für Astrophysik und Geophysik, Universität Göttingen, Friedrich-Hund Platz 1, D-37077 Göttingen, Germany
2
XMM-Newton Science Operations Centre, ESA, Villafranca del Castillo, Apartado 78, 28691 Villanueva de la Cañada, Spain
3
TPZ for ESA/ESAC, 28691 Villanueva de la Canada, Madrid, Spain
⋆⋆ Corresponding author: This email address is being protected from spambots. You need JavaScript enabled to view it.
Received:
1
April
2025
Accepted:
3
September
2025
Abstract
Context. PG 0043+039 has been identified as an extremely X-ray-weak quasar and as a peculiar broad-absorption-line quasar (BALQ) based on UV HST spectra.
Aims. This study aims to investigate the spectral properties and their variation in PG 0043+039 in more detail.
Methods. We took simultaneous deep X-ray observations of PG 0043+039 with XMM-Newton & NuSTAR, UV spectra with the HST, and optical spectra with the HET telescope in 2022.
Results. PG 0043+039 was an extreme low-X-ray-luminosity quasar in 2022. This AGN showed an extreme steep αox value of −2.47. These values are similar to those measured in 2005. The X-ray luminosity was a factor of 3.4 higher in the meantime in 2013. The optical and UV continuum only decreased by a factor of 1.3–1.5 from 2013 to 2022. Very strong emission-line intensity variations by factors of eight or more were observed in the O VI λ 1038 and Si IV λ 1403 lines between 2013 and 2022. The other UV emission lines such as Lyα only decreased by a factor of 1.4. The optical emission lines showed only minor intensity variations. We derive black hole masses of M = 6.95 × 10⁸ M⊙ (based on Hβ) and M = 3.53 × 10⁸ M⊙ (based on Mg IIλ2800). This corresponds to Eddington ratios of L/Ledd = 0.115 (Hβ) and 0.157 (Mg IIλ2800). PG 0043+039 exhibits strong and broad absorption lines in the UV. The highly ionized absorption lines show the largest velocity blueshifts in their broad absorption lines (BALs). Lower ionized BALs have smaller blueshifts. The P V absorption is very strong, with equivalent widths of 7–10 Å. PG 0043+039 shows strong Lyα emission despite strong P V absorption. PG 0043+039 is the only source with strong Lyα in the sample of strong P V absorbers. All the strong absorption-line troughs in the UV varied in unison in velocity space back and forward (−2000. ± 300. km s−1, +2740. ± 200. km s−1) without any major changes in absorption strength or in their profiles for the years 1991, 2013, and 2022. We found no general correlations of X-ray/opt/UV continuum variations with the broad absorption line variations. However, based on the simultaneous UV and X-ray observations – taken in 2013 and 2022 – we see higher maximum velocities of the blueshifted broad absorption lines in the UV when the X-ray flux was lower.
Key words: galaxies: active / galaxies: nuclei / quasars: absorption lines / quasars: emission lines / X-rays: galaxies / quasars: individual: PG 0043+039
Based on observations obtained with XMM-Newton & NuSTAR, HST, and the Hobby-Eberly Telescope (HET).
© The Authors 2025
 Open Access article, published by EDP Sciences, under the terms of the Creative Commons Attribution License (https://creativecommons.org/licenses/by/4.0), which permits unrestricted use, distribution, and reproduction in any medium, provided the original work is properly cited.
This article is published in open access under the Subscribe to Open model. This email address is being protected from spambots. You need JavaScript enabled to view it. to support open access publication.
1. Introduction
PG 0043+039 has been listed as a luminous radio-quiet quasar in the Palomar-Green catalog of ultraviolet-excess stellar objects (Green et al. 1986) with MV = −26.16. An optical spectrum of the Hβ region of PG 0043+039, taken in September 1990, was presented by Boroson & Green (1992). It shows very strong Fe II line blends and extremely weak [O III] λ 5007 emission. Furthermore, PG 0043+039 has been identified as a weak broad-absorption-line (BAL) quasar based on the C IV BAL detected with the Hubble Space Telescope (HST) in 1991 (Bahcall et al. 1993, Turnshek et al. 1994, 1997, Marziani et al. 1996).
A ROSAT non-detection established PG 0043+039 as an X-ray-weak quasar (Brandt et al. 2000). Non-detections in pointed observations with the ASCA satellite (Gallagher et al. 1999) as well as with XMM-Newton (Czerny et al. 2008) confirmed the extreme X-ray weakness of PG 0043+039. Kollatschny et al. (2015, 2016) detected PG 0043+039 in the X-ray based on very deep exposures taken with XMM-Newton in 2013. PG 0043+039 exhibited an extreme αox gradient (αox = −2.37). A reanalysis of XMM-Newton X-ray data that were taken in 2005 gave a similar extreme gradient, with αox = −2.53 for that year. The X-ray spectrum of 2013 was compatible with a normal quasar power-law spectrum and only moderate intrinsic absorption (NH =  × 1021 cm−2) and reflection. The most extreme αox gradient of PG 0043+039 and its extreme X-ray faintness – in comparison to other quasar samples – were discussed in Kollatschny et al. (2016).
The X-ray faintness of PG 0043+039 may have been caused by fluctuations in the accretion process, as seen in low state observations of other AGNs as such as PG 2112+059 (Schartel et al. 2010) or 1H0707-495 (Fabian et al. 2012). Furthermore, the X-ray spectral characteristics can also change because of changes of the column density and/or the ionization state of the X-ray-absorbing material. Examples are NGC 1365 (Risaliti et al. 2005) and NGC 7583 (Bianchi et al. 2009). Even the optical spectroscopic type of an AGN can change with time, as observed in changing-look galaxies such as Fairall 9 (Kollatschny & Fricke 1985), NGC 2617 (Shappee et al. 2014), SDSS-AGN (LaMassa et al. 2015), and IRAS 23226-3843 (Kollatschny et al. 2023).
The UV/optical flux of PG 0043+039 increased by a factor of 1.8 in 2013 compared to spectra taken from 1990-1991 (Kollatschny et al. 2016). The FUV spectrum of 2013 was highly peculiar and dominated by broad bumps and/or absorption troughs besides Lyα. There was no detectable Lyman edge associated with the BAL absorbing gas. PG 0043+039 showed a maximum in the UV/optical continuum flux at around λ ≈ 2500 Å in contrast to most other AGNs, where no maximum was found in this wavelength range.
X-ray-weak quasars often show broad absorption lines in the UV (Green et al. 1995, Brandt et al. 2000). Broad absorption-line systems may vary with time, as reported for WPVS 007 (Leighly et al. 2009), for example. The change in the broad UV absorption system was reflected in changes of the X-ray brightness in this object. Broad absorption-line quasars (BALQ) are divided into two categories: high-ionization broad absorption-line quasars (HiBALQs), showing blueshifted absorption from high-ionization lines such as C IV λ 1550, N V λ 1243, and Si IV λ 1403 (in order of decreasing typical strength); and low-ionization broad absorption-line quasars (LoBALQs) showing low-ionization absorption lines such as Mg II λ 2800 and/or Al III λ 1863 in addition to the high-ionization lines (Hall et al. 2002, Hamann et al. 2019, Choi et al. 2020, and references therein). An extreme subclass of HiBALQs are the P V BALs exhibiting strong P V λ 1128 absorption (Capellupo et al. 2017, Hamann et al. 2019). Blueshifts and high equivalent widths of highly ionized absorption lines – especially of P V outflows – are indications of strong galactic winds and high kinetic power in Quasar/ULIRG evolutionary studies (Veilleux et al. 2022). Many of these objects are X-ray-weak sources.
Here, we reinvestigated the X-ray weakness and/or X-ray variability of PG 0043+039 based on new and deep XMM-Newton & NuSTAR observations taken in 2022. Furthermore, we studied the highly peculiar UV spectra and their variations based on additional HST observations of this BAL quasar simultaneously to the X-ray observations. These observations were accompanied by new optical spectra. Finally, we investigated the combined optical-UV spectral energy distributions (SEDs) and their variations.
We took a redshift of z = 0.38463 ± 0.00008. The coordinates of PG 0043+039 are RA = 00:45:47.230 and Dec = +04:10:23.40 (2000). A luminosity of ν Lν = 2.21 × 1044 erg s−1 at 3000 Å has previously been determined for this quasar based on data from 1991 (Baskin & Laor 2004). This flux corresponds to an Eddington luminosity L/Ledd = 0.225 for a black-hole mass of M = 8.9 × 10⁸ M⊙ (Baskin & Laor 2005). Throughout this paper, we assume a ΛCDM cosmology with a Hubble constant of H0 = 69.6 km s−1 Mpc−1, ΩΛ = 0.714, and ΩM = 0.286 from Bennett et al. (2014). With a redshift of z = 0.385, this results in a luminosity distance of DL = 1512.5 Mpc = 4.67 × 1027 cm using the cosmology calculator developed by Wright (2006).
The paper is structured as follows. In Sect. 2, we describe the observations and data reduction. The results of our spectral and continuum variations in the UV, optical, and X-ray are presented in Sect. 4. We discuss these results in Sect. 5 and give a summary in Sect. 6.
2. Observations and data reduction
2.1. XMM-Newton observations
The XMM-Newton observatory (Jansen et al. 2001) conducted two observations of the source PG 0043+039 in the year 2022. The initial observation commenced on June 15, while the subsequent observation began on July 9.
The observation that commenced on June 15 with the observation identifier (ObsId) 9002303 was scheduled to last for a duration of 29.4 ks. The X-ray instruments, pn-camera (Strüder et al. 2001), and MOS-cameras (Turner et al. 2001) were forced to cease operation prematurely due to the presence of elevated radiation levels after approximately two-thirds of the scheduled time had elapsed. The observation initiated on July 9 with ObsId 9002306 was completed as scheduled for 112.2 ks. Both X-ray observations were significantly affected by elevated levels of background radiation, which resulted in the full scientific buffer being reached, as documented in the observation protocol.
During the observation initiated on July 9, the optical monitor was deactivated due to the proximity of Jupiter to the target position, which rendered the instrument inoperable. Pipeline1 (compare with Webb et al. 2020) screening for low-background time intervals identified 11.4 ks of suitable data for the central region of the detectors for the observation initiated on June 15, and 87.515 ks for the observation initiated on July 9. The results are employed in the forthcoming analysis.
2.2. NuSTAR observation
The NuSTAR observatory conducted an observation of PG 0043+039 between 9 July, 2022, 11:41:08, and 10 July, 2022, 21:41:11, under the unique observation number 80801603002. During the observation, 59 912 seconds of effective exposure were achieved for FPMA and 59 273 seconds for FPMB.
2.3. UV and optical continuum observations with SWIFT
We could not use the coaligned 30-cm optical/UV telescope (OM) on board the XMM-Newton satellite as Jupiter was too near to our target in July 2022. Therefore, we took additional simultaneous observations in the UV and optical continuum bands with SWIFT on July 10, 2022. The exposure time was 2.7 ks.
2.4. UV (COS) spectroscopy with HST
We observed PG 0043+039 over two full HST orbits with the COS spectrograph on July 10, 2022. The COS spectrograph offers two independent observing channels. The first orbit was devoted to a spectrum taken with the far-ultraviolet (FUV) detector, which is sensitive to wavelengths between 900 and 2150 Å. The second orbit was devoted to a spectrum taken with the near-ultraviolet (NUV) detector, which is sensitive to wavelengths from 1650 to 3650 Å.
For the first orbit, we used the COS/FUV spectrograph with the G140L grating and a 2.5 arcsec aperture (circular diameter). This spectral set covers the wavelength range from 1105 Å to 2150 Å with a resolving power of 2000 at 1500 Å. To fill up the wavelength hole produced by the chip gap and reduce the fixed pattern noise, we split this observation into four separate segments of 268 s and four different central wavelengths. The final exposure time of the integrated FUV spectrum was 1072 s. The observed FUV spectrum corresponds to 800 Å till 1552 Å in the rest frame of the galaxy.
For the second orbit, we used the COS/NUV spectrograph with the G230L grating and a 2.5 arcsec aperture. The full NUV spectrum covers the wavelength range from 1671 Å to 3642 Å with a mean resolving power of 3000. Obtaining the full NUV spectrum with G230L requires four CENWAVE settings at 2635, 2950, 3000, and 3360 Å. Again, we split the observations of each setting into four separate segments of 22 s for reducing the fixed pattern noise. Finally, we combined all the individual NUV spectra into one NUV spectrum with an integrated exposure time of 352 s. The observed NUV spectrum from 1671 Å to 3642 Å corresponds to 1207 Å to 2630 Å in the rest frame of the galaxy.
All the original raw data were processed using the standard COS calibration pipeline CalCOS. We corrected the UV spectra as well as our optical spectra of PG 0043+039 for Galactic extinction. We used a reddening value of E(B − V) = 0.018 deduced from the Schlafly & Finkbeiner (2011) re-calibration of the Schlegel et al. (1998) infrared-based dust map. Furthermore, we applied the reddening law of Fitzpatrick (1999) with RV = 3.1 to our UV/optical spectra.
2.5. Optical spectroscopy with the HET telescope
We took new optical spectra of PG 0043+039 with the 9.2m Hobby-Eberly Telescope (HET) at McDonald Observatory on October 16, 2019; July 9, 2022; and July 17, 2024. The spectra were taken with the blue unit of the second-generation Low-Resolution Spectrograph (LRS2-B; Chonis et al. 2016) attached to the HET.
LRS2 is an integral field spectrograph with four spectral channels covering 3640 Å to 10500 Å in separate blue and red units (LRS2-B and LRS2-R, respectively), each fed by lenslet-coupled fiber internal field units (IFUs). Each IFU covers 12″ × 6″ with 0.6″ spatial elements and full fill-factor, and couples to 280 fibers. The IFUs are separated by 100″ on sky. For the present study, we only utilized the LRS2-B unit, which simultaneously covers the wavelength ranges from 3640 to 4670 Å and 4540 to 7000 Å (referred to as the UV and Orange channels, respectively) at fixed resolving powers of R ∼ 2500 and 1400, respectively. Table 1 gives the log of our spectroscopic observations. All spectra were taken with identical instrumental setups and at the same airmass, owing to the particular design of the HET with fixed altitude.
Log of optical spectroscopic observations of PG 0043+039 taken with HET.
The 280 fiber spectra in each of the UV and Orange channels of LRS2-B were reduced with the automatic HET pipeline, Panacea2. This pipeline performs basic CCD reduction tasks, wavelength calibration, fiber extraction, sky subtraction, and flux calibration.
All wavelengths were converted to the rest frame of the galaxy at z = 0.38463 ± 0.00008. This redshift is based on a reanalysis of the narrow [O II] λ 3727 line in the spectrum from 2013 when the galaxy was in its highest state. We would obtain a redshift of z = 0.38503 ± 0.00008 if we used the broad Mg II λ 2800 line as our reference. Ho & Kim (2009) derived a redshift of z = 0.38512 ± 0.000009 based on a spectrum that they took in 2004.
3. Data analysis
Here, we present the results of our observing campaign based on the data obtained in the X-ray, UV, and optical frequency bands.
3.1. XMM-Newton
The XMM-Newton observation conducted on June 15, 2024 yielded no detections of the X-ray source. Table 2 presents the two-sigma upper limits for three energy bands and the three detectors. The sources were identified with a high level of statistical significance in the optical monitor. For reference purposes, the corresponding fluxes are presented in Table 3.
2-sigma X-ray upper limits for 2022-06-15 XMM-Newton observation.
XMM-Newton OM fluxes on 2022-06-15.
In the XMM-Newton observation conducted on 9 July 2024, PG 0043+039 was unambiguously identified as a weak source. Table 4 presents the X-ray fluxes across five energy bands. In consideration of the limitations of the source data, we proceeded to fit only the pn-spectrum. A power law with absorption fixed at NH = 2.99 × 1019 cm−2 was assumed (Lockman & Savage 1995). Utilizing 38 bins, we obtained a C-value of 31.74. The resulting values for Γ and Norm were 1.46 and 7.34
 photons keV s−1 cm−2 at 1 keV, respectively.
X-ray fluxes for 2022-07-9 XMM-Newton observation.
3.2. NuSTAR
The 2σ upper limits for the NuSTAR observation at the optical position of PG 0043+039 were determined. It was assumed that the source region would be circular with a radius of 30 arcsec, while the background region would be circular with a radius of 90 arcsec, situated at a distance of 3.0 arcmin from the source. Assuming a power law with an index of 2, the 2σ upper limit for each detector is 4.5 × 10⁻⁷ photons s−1, which corresponds to 1.0 × 10⁻¹⁴ erg s−1 cm−2 for the energy range from 10 to 20 keV.
3.3. SWIFT
The derived fluxes in the SWIFT bands are presented in Table 5. The central wavelengths of the SWIFT UVOT filters are given in Poole et al. (2008). The SWIFT filter curves are not exactly the same as those of the XMM-Newton OM telescope. However, the measured flux values in the UV and optical bands are identical within a few percent for the observations taken on 2022-06-15 and 2022-07-10. Furthermore, the flux values agree with those based on the UV/optical spectra.
SWIFT fluxes on 2022-07-10.
3.4. UV spectral observations with HST in 2022
The combined NUV and FUV spectra of PG 0043+039 – obtained in July 2022 with the HST – are presented in Fig. 1. The HST spectrum has been smoothed by means of a running mean width of Δλ = 2.0 Å for highlighting weaker spectral structures. We do not show the reddest G230L segment (central wavelength at 3360 Å in observed frame) here because of its low S/N ratio. This wavelength segment (2090–2600 Å in rest frame) is additionally presented in Fig. 3 together with the optical spectrum. This segment had to be smoothed by means of a running mean width of Δλ = 15. Å because of its low S/N ratio. We indicate the location of possible emission lines, the geo-coronal lines Lyα and O VI, as well as the position of possible broad absorption troughs in Fig. 1. Only four emission lines (Lyα, N Vλ1243, Si IV λ 1403, and C III] λ1909) can be unambiguously identified, besides the two geocoronal lines. It is unclear what the reason is for the emission redward of the N Vλ1243 line. The emission lines as well as the absorption troughs and their variations are discussed in Section 5.
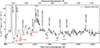 |
Fig. 1. Hubble Space Telescope UV spectrum of PG 0043+039 taken in July, 2022. The location of possible emission lines is indicated above the spectrum (in black). Absorption troughs are indicated below the spectrum (in red). |
3.5. Optical spectra in 2022
The combined optical spectrum – obtained with the HET telescope in July, 2022 – is shown in Fig. 2. The observed spectrum based on the UV and Orange channels of the LRS2-B spectrograph covers the wavelength range of 3750–6800 Å in the observed frame and 2650–5020 Å in the rest-frame system. The spectrum is dominated by the broad Balmer lines Hβ, Hγ, and Hδ; a narrower Mg II λ 2800 line; and strong Fe II blends. One can identify the strong Fe II blend between 4450 and 4700 Å based on the Fe II multiplets 37, 38, and 43, as well as many bumps between 2600 and 4000 Å – for example at 2950 and 3200 Å – caused by blends of many thousand Fe II lines (e.g., Sigut & Pradhan 2003).
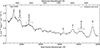 |
Fig. 2. Observed optical spectrum of PG 0043+039 from July, 2022. |
3.6. Combined optical UV spectrum in 2022
We present a combined optical-UV spectrum of PG 0043+039 – based on the data taken in July 2022 – in Fig. 3. We tried to fit a power law to the UV optical continuum. Because of the strong absorption troughs in combination with overlapping broad emission lines in the UV it is demanding to find continuum regions that are not contaminated. Finally, we used three continuum regions at 2666 ± 10, 3555 ± 15, and 4734 ± 30 Å to fit a power law to the continuum spectrum (see Fig. 3). We obtain a gradient of α = 1.317 with fλ ∼ λ−α. This fit is a first-order approximation to the optical/near-UV continuum gradient of PG 0043+039 in 2022.
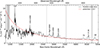 |
Fig. 3. Combined UV-optical spectrum of PG 0043+039 in 2022. A power-law model (in red) was fit to the continuum, giving a spectral index of α = 1.317. The spectral regions that were used for deriving the power-law slope of the continuum are shown in gray. |
4. Results
4.1. Continuum and emission-line variations in the optical
In Fig. 4, we show optical spectra of PG 0043+039 taken with the HET telescope in the years 2013, 2022, 2019, and 2024. One can see clear variations in the continuum flux, in the continuum gradient, in the Balmer and Fe II intensities, as well as in the Mg IIλ2800 line flux and line profile. Mg IIλ2800 evidently shows a narrower line profile than the Balmer lines. The line profiles are discussed in more detail in Section 5.3.
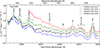 |
Fig. 4. Optical spectra of PG 0043+039 taken in 2022, as well as in the years 2013, 2019, and 2024. |
Table 6 gives the optical continuum intensities at 3552 and 4734 Å rest frame, as well as the Balmer, Fe II(37,38), and Mg IIλ2800 intensities for the year 2022, and furthermore for the years 2013, 2019, and 2024. In addition, we list the integration limits in column 7. For Hβ, we subtracted a constant continuum value measured at 4762 Å because we have no continuum value on the red side of this line as the spectrum ends at 5012 Å in the rest frame, except for the year 2013. One can see in the spectrum taken in 2013 (Kollatschny et al. 2016, Fig. 8) that the continuum value is lower by 10% on the red side compared to the blue side. Furthermore, we now integrate over a smaller wavelength range than in Kollatschny et al. (2016). This leads to a general underestimation for the integrated Hβ flux of the order of 30% in Table 6. However, the relative Hβ variations for the different epochs are more correct.
Emission line and continuum intensities in rest frame and corrected for Galactic extinction for the years 1991 up to 2024.
For Hγ and Fe II λλ 4500, we first subtracted a continuum based on the continuum intensity values at 4207 and 4734 Å before integrating the line intensities. This procedure gives a good estimation for the relative line variations. The measured Hγ line intensities are larger than the intrinsic values because the underlying continuum is contaminated by strong Fe II blends.
Figure 5 shows the mean optical spectrum of PG 0043+039 based on the spectra for the years 2013, 2019, 2022, and 2024. The mean spectrum shortward of 3173 Å is lower because it is based on only three spectra (2019, 2022, 2024) when PG 0043+039 was in a lower state. The optical and UV spectra in PG 0043+039 down to ∼2400 Å are dominated by strong UV continuum flux and strong Fe II line blends. See also Figs. 7 and 13 in Kollatschny et al. (2016) and Fig. 1 in Turnshek et al. (1994). Early observations of the UV bump in quasars as well as its modeling are discussed in, for example, Grandi (1982) and Wills et al. (1985). Recent modeling of the Fe II UV emission is presented in Pandey et al. (2024).
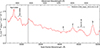 |
Fig. 5. Mean optical spectrum of PG 0043+039 based on years 2013, 2019, 2022, and 2024. The mean spectrum shortward of 3173 Å (dashed line) is lower because it is based on three spectra only (2019, 2022, 2024). |
Figure 6 shows the optical rms spectrum based on the years 2013, 2019, 2022, and 2024. The rms spectrum presents the variable part of the spectra. One can recognize strong variations in the UV continuum, in the Balmer lines, and especially in the Mg II λ 2800 line. The Fe II blends show only minor variations. The overlapping region of the UV and Orange channels of the LRS2-B spectrograph is shown in gray. The intercalibration of these two channels was not perfect in our case; i.e., not better than three percent. The relative flux of the UV channel has been slightly underestimated in its original data. The sharp drop at 3170 Å is caused by the fact that the rms spectrum blueward of this wavelength is based on only three spectra of the years 2019, 2022, and 2024, while the redward spectrum is based on four spectra of the years 2013, 2019, 2022, and 2024. The strong increase of the variable flux from 4000 Å to 3170 Å in Fig. 6 must be caused by a variable continuum component and not by variations of Fe II blends because it rises so smoothly.
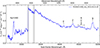 |
Fig. 6. Optical rms spectrum of PG 0043+039 based on years 2013, 2019, 2022, and 2024. The overlapping region of the UV and Orange channels of the LRS2-B spectrograph is shown in gray. The rms spectrum shortward of 3173 Å (dashed line) is based on three spectra only (2019, 2022, 2024). |
4.2. Continuum and emission-line variations in the UV
Figure 7 shows the HST UV spectra up to 2200 Å in the rest frame taken during the years 1991, 2013, and 2022. The locations of possible emission lines as well as the geocoronal lines are indicated above the spectrum. The UV spectra have signal-to-noise ratios of 13.9 in 1991, 9.1 in 2013, and 8.9 in 2022 in their continuums at 1420 ± 20Å. Besides continuum variations and variable broad emission lines, as seen in the optical, we also note very broad and variable absorption troughs in the UV. They vary independently in strength and shape. That makes it very demanding to estimate the continuum below the broad UV emission lines. We list the UV continuum intensities at 1288 and 1818 Å rest frame, as well as the UV-emission-line intensities of, for example, Lyα for the years 1991, 2013, and 2022 in Table 6. In the UV, we rearranged the continuum in comparison to Paper 1. We now take into account stronger absorption troughs. The same is true for the Lyα and N V λ 1243 emission lines where we now set the continuum value at 1288 Å. The line complex Si II λ 1308 + O I λ 1302 is highly variable with respect to its intensity and wavelength ranges when comparing the spectra from 1991 with those from 2013. This line is not recognizable in the spectrum taken in 2022. The high ionization O VI λ 1038 line was strong and clearly present in 2013 when the UV/X-ray flux was strongest. However, it is only marginally detectable in 2022. The O VI λ 1038 and Si IV λ 1403 lines decreased by factors of eight or more between 2013 and 2022. The other UV emission lines such as Lyα only decreased by a factor of 1.4. These measurements are affected by major errors because of parallel variations of the absorption troughs. In contrast to that, the optical emission lines exhibited only minor intensity variations between 2013 and 2022.
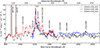 |
Fig. 7. HST UV spectra of PG 0043+039 taken in years 1991, 2013, and 2022. |
Figure 8 shows the UV mean spectrum of PG 0043+039 based the HST spectra for the years 1991, 2013, and 2022. The location of possible emission lines is indicated by tick marks above the spectrum. Figure 9 shows the UV difference spectra for the years 1991 and 2013 with respect to the minimum spectrum from 2022. The difference spectra demonstrate the strong variations of some emission lines in terms of intensity as well as the additional absorption variability in intensity and velocity. We will discuss this in more detail in Section 4.3.
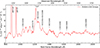 |
Fig. 8. HST UV mean spectrum of PG 0043+039 for years 1991, 2013, and 2022. |
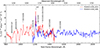 |
Fig. 9. HST UV difference spectra for 1991 and 2013 with respect to the minimum spectrum from 2022. |
4.3. Combined optical and UV continuum variations
We present the UV and optical spectra of PG 0043+039 taken in 2013 and 2022 as well as modeled power-law spectra based on the optical continuum data for these years in Fig. 10. In addition, the UV spectrum taken in 1991 is overlaid. Figure 10 is an extension of Fig. 3. The spectral regions that were used for deriving the power-law slope of the continuum are shown in gray. In principle, we are able to model the combined optical-near-UV continuum for the year 2022 with a simple power law fλ ∼ λ−α, where the gradient α has a value of 1.317 (see Section 3.6). PG 0043+039 was in its lowest state during that year. The slope in the UV is very uncertain due to the strong absorption troughs and emission lines. When we try to fit the optical continuum for the year 2013, when PG 0043 was in a high state, we obtain a gradient of α = 1.69. However, in the far-UV we observed a negative gradient for that year (see Kollatschny et al. 2016). The far-UV continuum also exhibited a negative gradient in 1991.
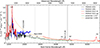 |
Fig. 10. UV and optical spectra of PG 0043+039 for 2013 and 2022, as well as modeled power-law spectra based on the optical continuum data for 2013 and 2022. In addition, the UV spectrum taken in 1991 is shown. |
These observations imply not only that the general continuum gradient is changing in the optical, but also that the observed continuum in the UV changes to an inverted gradient at around 2450 ± 100 Å (see Kollatschny et al. 2016, Turnshek et al. 1994). The wavelength of this turning point did not change at all from 1991 (Turnshek et al. 1994) to 2005 based on XMM-Newton OM observations (see Fig. 13 in Kollatschny et al. 2016), or to 2013 (Kollatschny et al. 2016), and up until 2022, independent of the different continuum flux levels and continuum gradients. An evolution in the spectral energy distribution can be seen: when the optical continuum flux and the gradient were stronger in the years 1991 and 2013, the break and the inverse gradient in the far-UV were stronger as well. However, when the optical continuum flux and the gradient were flatter in 2022, the inverse gradient in the far-UV was flatter as well. This is similar to the general finding of Meusinger et al. (2016) and others that 3000 Å break quasars tend to be intrinsically more luminous than ordinary quasars.
The strong deficit in flux shortward of 2400 Å might be explained with an anomalous steep reddening curve (e.g.,Turnshek et al. 1994, Hall et al. 2002, Veilleux et al. 2013, Kollatschny et al. 2016, Meusinger et al. 2016, Choi et al. 2020). Another possibility is the existence of an accretion disk with a strongly suppressed innermost region (Hall et al. 2002, Kollatschny et al. 2016) or a combination of both effects.
In Kollatschny et al. (2016), we present the result that the equivalent-width ratios of the strongest UV emission lines (O VI λ 1038, Lyα, N V λ 1243 ) in PG 0043+039 are similar to those of a composite spectrum of a normal AGN (Shull et al. 2012). The Lyα emission line intensity in PG 0043+039 is always stronger than the N V λ 1243 flux for all observations. This behavior of PG 0043+039 is different with respect to that of all the P V BALs in the samples of Capellupo et al. (2017) and Hamann et al. (2019), where the Lyα-emission-line intensity is always significantly weaker than the N V λ 1243 line (see Section 5.4).
5. Discussion
5.1. X-ray, UV, optical continuum variations, and αOX variations for the years 2005, 2013, and 2022
We present the X-ray, UV, and optical continuum intensities in Table 7 to demonstrate their variations from 2013 to 2022 and their αox and L2keV variations. We also list the X-ray flux and αox values for 2005 (Kollatschny et al. 2016). All flux values decreased from 2013 to 2022. However, the drop was far stronger in the X-ray (a factor of 3.4) than in the optical/UV, where the flux decreased by 25–30%. The relatively low flux in the X-ray with respect to the UV flux – when the galaxy became fainter – is consistent with the general αox – LUV anti-correlation (e.g., Wilkes et al. 1994; Gibson et al. 2008a).
X-ray, UV, and optical continuum flux variations, as well as αox and L2keV variations.
We present the αox gradient for samples of AGNs and for PG 0043+039 as a function of the monochromatic luminosity at the rest frame 2500 Å in Fig. 11. Black dots mark the SDSS objects from Strateva et al. (2005), while gray filled circles mark the data from Steffen et al. (2006). Further measurements of extreme X-ray weak quasars are indicated by cyan pentagons (Saez et al. 2012), blue and yellow open triangles (Schartel et al. 2010, Schartel et al. 2007, Ballo et al. 2011), and a green star (Ballo et al. 2008). A similar figure – without the new values from 2022 – was presented in Kollatschny et al. (2016). Additional data of high-λEdd AGNs and X-ray-weak quasars are from Laurenti et al. (2022) (dark blue filled triangles) and Zappacosta et al. (2020) (magenta open diamonds). The solid black line gives the best-fit relation from Lusso et al. (2010) with the 1σ spread (dashed lines) (see Fig. 5 in Laurenti et al. 2022). The blue line is the best-fit relation from Martocchia et al. (2017). The solid green line marks X-ray weakness (Pu et al. 2020).
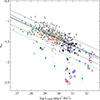 |
Fig. 11. αox gradient as function of monochromatic luminosity at rest frame 2500 Å. Black dots mark the SDSS objects from Strateva et al. (2005), while gray filled circles mark the data from Steffen et al. (2006). Further measurements of extreme X-ray weak quasars are indicated by cyan pentagons (Saez et al. 2012), blue and yellow open triangles (Schartel et al. 2010, 2007; Ballo et al. 2011), dark blue filled triangles (Laurenti et al. 2022), and magenta open diamonds (Zappacosta et al. 2020). The positions of PG 0043+039 are highlighted for the years 2005 (red square), 2013 (black circle), and 2022 (filled purple hexagon). The solid black line gives the best-fit relation from Lusso et al. (2010) with the 1σ spread (dashed lines) (see Fig. 5 in Laurenti et al. 2022). The blue line is the best-fit relation from Martocchia et al. (2017). The solid green line marks the line for X-ray weakness (Pu et al. 2020). |
The positions of PG 0043+039 are highlighted for the years 2005 (red square), 2013 (black circle), and 2022 (filled purple hexagon). PG 0043+039 shows, among all galaxies, the most extreme αox gradient (αox = −2.53 ± 0.04) in the year 2005. The value of αox = −2.37 ± 0.04 increased slightly in the 2013 data. Afterwards, the gradient again decreased to an extreme value of αox = −2.47 ± 0.04 in 2022. The error of αox is based on the errors of the X-ray fluxes (Table 4) and the errors of the UV fluxes (Table 3). We can certify that the X-ray faintness of PG 0043+039 is intrinsic and not simulated by variations because of our simultaneous observations in the different frequency ranges.
5.2. The Eddington ratio
Baskin & Laor (2004, 2005) derived an Eddington ratio of L/Ledd = 0.225 for PG 0043+039 based on a black-hole mass of M = 8.9 × 10⁸ M⊙ (Baskin & Laor 2005). We now calculate Eddington ratios based on the Hβ and Mg IIλ2800 lines for the year 2022. We derived black-hole masses of M = 6.95 × 10⁸ M⊙ (Hβ) and M = 3.53 × 10⁸ M⊙ (Mg IIλ2800) based on the formulas given in Trakhtenbrot & Netzer (2012), on the line widths (FWHM), and the luminosities of L5100 = 1.26 × 1045 erg s−1 and L3000 = 1.42 × 1045 erg s−1. With a bolometric correction (BC) according to Netzer (2019), we derived Eddington ratios of L/Ledd = 0.115 (Hβ) and 0.157 (Mg IIλ2800). The derived Eddington ratios are moderate to high but not as extreme as the ‘super-Eddington’ objects presented in Laurenti et al. (2022). However, we have to keep in mind that our observed luminosities might be lower limits because the central UV continuum source is partially covered by outflowing gas (see Section 5.4).
Laurenti et al. (2022) presented in their work a X-ray spectral analysis and UV/opt photometry of 14 highly accreting AGNs with high Eddington ratios Ledd ⪆ 1. Their sample is a subsample of high-luminous galaxies (Marziani & Sulentic 2014) showing extremely strong Fe II emission, weak [O III] emission, and narrow emission lines with FWHM(Hβ) ≤ 4000 km s−1. The X-ray properties of their sample were quite heterogeneous despite the homogeneity of the sample with respect to the high-Eddington ratios. Thirty percent of their sources were extremely X-ray weak (see their αox values in Fig. 11). Figure 12 shows the αox gradient as a function of the Eddington luminosity log λEdd for a quasar sample of sub- to super-Eddington AGNs. The AGN sample is from the work of Laurenti et al. (2022) (their Fig. 5, right panel). PG 0043+039 is a clear outlier in this diagram.
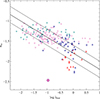 |
Fig. 12. αox gradient as function of Eddington luminosity log λEdd. The position of PG 0043+039 (in the year 2022) is highlighted (filled purple hexagon). The other AGNs are from Laurenti et al. (2022), Lusso et al. (2010), Liu et al. (2021), and Zappacosta et al. (2020) divided into different regimes of bolometric luminosity as presented by Laurenti et al. (2022) (their Fig. 5, right panel). The solid line represents the best-fit relation from Lusso et al. (2010). The dashed lines give the 1σ spread of their relation. |
PG 0043+039 is as well an extremely X-ray weak source and shows very weak [O III] emission as well as strong optical Fe II emission with RFe II = EW(Fe IIλ 4570)/EW(Hβ) = 0.8. However, it is a Pop B object (see Marziani & Sulentic 2014) with respect to its FWHM(Hβ) of 5000 km s−1. Furthermore, its Eddington ratio of 0.1 is only moderate with respect to the highly accreting Pop A objects in the sample of Laurenti et al. (2022) having RFe II ≥ 1.
5.3. UV and optical emission-line profiles
We present the scaled Hβ emission line profiles in velocity space for the epochs 2013, 2019, 2022, and 2024 in Fig. 13. The Hβ profiles remained constant within a few percent over this period of time. The line widths (FWHM) and the shifts of the line centers of all optical and UV emission lines are listed in Table 8. The line shifts are given with respect to the narrow [O II] λ3727 line. The narrow [O II] λ3727 line could only be verified in the spectrum taken in 2013 when the galaxy was in its highest state. The [O III] λλ4959,5007 lines are not detectable. Therefore, they could not be used for the intercalibration of the optical spectra.
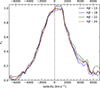 |
Fig. 13. Scaled Hβ line profiles for the epochs 2013, 2019, 2022, and 2024. |
Measured line widths (FWHM) and shifts (uppermost 10%) of the strongest broad emission lines.
Figure 14 shows the scaled mean profiles of the Balmer emission lines Hβ and Hγ based on the years 2013, 2019, 2022, and 2024, and Lyα based on the years 1991, 2013, and 2022. The profiles of the Balmer lines are identical within the errors. However, the Lyα emission profile is clearly narrower and its line center is blueshifted by about 1000 km s−1 in comparison to the Balmer lines. Blueshifted Lyα emission has also been detected before in a sample of ultraluminous galaxies (ULIRGs) (Martin et al. 2015). They explained the blueshift as emission from fast, hot wind. However, our Lyα line is not as broad as the Balmer lines. A certain amount of absorption in the red Lyα emission wing may have been caused by blueshifted N Vλ1243 absorption (see Section 5.4).
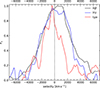 |
Fig. 14. Scaled mean Balmer and Lyα emission-line profiles. |
The measured widths and shifts of the UV emission lines (Table 8) are highly affected by strong and variable UV absorption troughs (see Sections 5.4 and 5.6). An identification of the Si II λ 1306 + O I λ 1303 emission line is insecure. It seems that this line was blueshifted in 2012. However, it is not even ultimately verifiable for the year 2022. It is uncertain whether this finding is caused by emission-line variability or by highly variable absorption troughs. In Fig. 15, we present the mean Balmer line profiles together with the O Iλ1302+Si IIλ1308 profile taken in 1991. They show the same profile and shift.
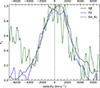 |
Fig. 15. Scaled mean Balmer and Si IIλ1308 (1991) emission-line profiles. |
The width as well as the shape of the Balmer emission lines is different with respect to the Mg IIλ2800 line (see Fig. 16). The Balmer lines show a FWHM of 5050. ± 200. km s−1, while the Mg IIλ2800 line only has a FWHM of 2910. ± 200. km s−1. Furthermore, the Balmer lines show flat topped profiles. The central region of the Balmer lines is shifted by +600. ± 200. km s−1, while the steep Mg IIλ2800 line is shifted by only +120. ± 50. km s−1. The low-ionization Mg IIλ2800 line shows the narrowest emission-line width (FWHM) of 2910. ± 200. km s−1, while the other emission lines have widths of 4000. to 5000. km s−1 (see Fig. 16). In this plot, we show the profile of the high-ionization O VIλ1038 line taken in 2013. The high-ionization O VIλ1038 line is broader than the low-ionization Mg IIλ2800 line. However, both profiles (Mg IIλ2800 and O VIλ1038) are narrower than those of the Balmer lines. The O VIλ1038 emission is clearly detected in 2013. However, the identification is insecure for 2022 (Fig. 7) due to its low flux and/or additional absorption. The variable absorption troughs in that region will be discussed in more depth in Sections 5.4 and 5.6.
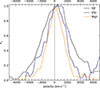 |
Fig. 16. Scaled mean Hβ, O VIλ1038, and Mg IIλ2800 emission-line profiles. |
Figure 17 shows the low-ionization Mg IIλ2800 line together with the high-ionization N Vλ1243 line. Both lines are narrow. However, the N Vλ1243 line shows an additional strong red component at 5000 km s−1 in 2013. This red component was even stronger than the central component in 1991 (Fig. 7). It is not clear whether this red component belongs to the N Vλ1243 line or whether it has an unknown origin.
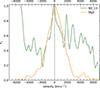 |
Fig. 17. Scaled mean Mg IIλ2800 and N Vλ1243 (2013) emission-line profiles. |
Overall it can be noted that the emission-line intensity variations and their profiles are highly peculiar. There is no clear trend that the higher ionized lines show broader profiles. There is not even any clear evidence for C IVλ1550 emission.
5.4. UV absorption-line troughs in 2022 and comparison to the years 1991 and 2013
Figure 18 shows the UV BAL profiles in velocity space normalized to the local continuum for the UV spectra taken in 2022. The velocities are scaled relatively to the red component of the doublet lines indicated by the dashed line. The local continua are sometimes difficult to determine because of the overlap with additional variable emission-line components and the superposition of further absorption troughs. This applies particularly to the Lyα and C III λ 1175 lines. Therefore, the given equivalent widths of the absorptions troughs (Table 9) have errors of up to 20%. The UV BAL profiles for the years 2013 and 1991 are shown for comparison in Fig. 19 and Fig. 20.
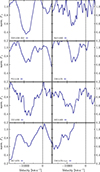 |
Fig. 18. UV absorption-line troughs in 2022. |
UV absorption trough equivalent widths, outflow velocities (max/min), FWHM, and their depths.
The rest equivalent widths, Wλ, of our measured UV absorption lines, the blue and red limits of the outflow velocities, the modified full widths at half minimum after subtracting the doublet separations, and the maximum line depths in the normalized spectra are presented in Table 9. In some cases, we cannot give a blue limit of the Lyα λ1216 outflow velocities because of the superposition of the Lyα λ1216 absorption trough with that of the C III λ 1176 trough. The strength of a N Vλ1243 absorption cannot been estimated because of the superposition with the variable Lyα λ1216 emission line and with the Lyα λ1216 absorption trough. The following doublet separations have been taken into account in Table 9: O VI λ 1038 : 1647 km s−1; S IV λ 1074 : 2796 km s−1; P V λ 1128 : 2660 km s−1; Si IV λ 1403 : 1924 km s−1; C IV λ 1550 : 503 km s−1; Al III λ 1863 : 1288 km s−1.
PG 043+039 is an extreme LoBAL based on i) its very strong C IV BAL absorption, ii) its unusually strong P V absorption, as well as iii) its large velocity shift of nearly −20 000 km s−1 in the C IV BAL. PG 043+039 exhibits P V λ 1128 equivalent widths of 7–10 Å. Such high values are typical for P V BALs (Hamann et al. 2019). The resolved P V λ 1128 doublet shows an observed saturated depth ratio near 1:1. This is a typical ratio, as seen elsewhere in other BALs (Hamann et al. 2019, and references therein). Such a ratio requires optical densities of log NH (cm−2) ≳22.7 and large ionization parameters of log U ≳ −0.5 (Hamann et al. 2019). It implies that most UV outflow line ratios such as Si IV λ 1394,1403 or O VI λ 1032, 1038 are also saturated. A detection of the low abundance-line P V λ 1128 doublet implies large column densities. The C IV trough does not reach zero intensity. This indicates that the outflowing gas only partially covers the UV continuum source by a clumpy inhomogeneous medium (see also Capellupo et al. 2017).
We now compare the absorption troughs among each other for the individual observations in the years 2022, 1991, and 2013, as well as in comparison to each other. We do this because the general absorption shifts are different for the individual years. The highly ionized absorption lines such as O VI λ 1038, C IV λ 1550, Si IV λ 1403, S IV λ 1074, and P V λ 1128 show the largest velocity shifts in their BALs. The flux minima in lower ionized BALs such as C III λ 1176 and Al III λ 1863 have smaller blueshifts (see Figs. 18, 19, and 20, and Table 9). This is consistent with detailed studies on other QSO BAL outflows (Hamann et al. 2019). Weak He II λ 1640 emission-line intensity is correlated with larger BAL outflow speeds (Hamann et al. 2019). This is consistent with the spectrum taken in 1991 where we see the largest outflow velocities. There is no clear He II λ 1640 emission line detection for the year 2022 when the outflow velocities were lower.
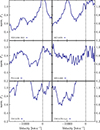 |
Fig. 19. UV absorption-line troughs in 2013. |
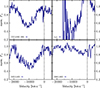 |
Fig. 20. UV absorption-line troughs in 1991. |
In addition, we found strong evidence for the presence of He II λ 1640 absorption in the 2022 spectrum (see Figs. 1 and 18). This absorption has not been identified in the P V BAL samples of Capellupo et al. (2017) and Hamann et al. (2019). Furthermore, the spectra in their samples always show weaker Lyα emission relative to N Vλ1243 emission or no Lyα emission at all. In contrast to these samples, PG 0043+039 exhibits strong Lyα emission, which is typical for normal quasars.
5.5. Interpretation of the combined absorption- and emission-line variations in the far-UV
We present a possible interpretation of the far-UV spectra of PG 0043+039 in 2013 (Kollatschny et al. 2015). The UV spectrum (shortward of 1600 Å) showed very bumpy structures in addition to only a few clear emission lines such as Lyα. It was not clear whether the bumpy structure is caused by strong absorption features or by strong emission components. In Kollatschny et al. (2015), we proposed cyclotron emission lines as the cause for the observed broad bumps – based on modeling of the far-UV spectra.
These emission bumps as well as the absorption structures did not remain constant in intensity and wavelength space in the 2022 data. In principle, we can reproduce the blueshifted spectral distribution of UV emission lines (or absorption troughs) for the year 2022 based on cyclotron lines for slightly higher field strengths than in 2013. An increase of the magnetic field leads to simultaneous wavelength shifts of all cyclotron lines and their higher harmonics (Kollatschny et al. 2015). However, based on the new spectra taken in 2022 and in comparison with other extreme P V BAL sources (e.g., Borguet et al. 2013, Capellupo et al. 2017, Hamann et al. 2019), it now seems more probable that the observed UV spectral structures are caused by broad absorption troughs (see Sects. 4.3 and 5.4). On the other hand, it is still difficult to explain the emission component redward of the N V λ 1243 line (see Figs. 1, 17) in an easy way.
5.6. General absorption-trough variations in velocity space for the different epochs
We show the HST UV spectra for the years 1991, 2013, and 2022 in Fig. 7. There, you can see clear variations in the absorption-line troughs. Furthermore, we present UV difference spectra in Fig. 9. One can recognize that there are strong variations in the absorption troughs as well as in the emission lines. To study the absorption-line variability in more detail, in Figs. 18, 19, 20, and Table 9 we show the UV BAL profiles in velocity space normalized to the local continuum for the years 2022, 2013, and 1991. Besides the general trend that highly ionized absorption lines show the largest blueshifts and less ionized lines show smaller blueshifts, there is superimposed a second trend: all the absorption troughs of 2013 are redshifted with respect to the troughs of 2022 and all the absorption troughs of 1991 are blueshifted with respect to the troughs of 2022.
To compare the variability of the general absorption pattern, in Fig. 21 we show the scaled 2013 spectrum with respect to that of 2022. The 2013 spectrum has been multiplied by a factor of 0.692 and blueshifted by 10.5 Å corresponding to 2740. ± 200. km s−1. Similarly, in Fig. 22 we compare the general absorption pattern of the scaled 1991 spectrum to that of 2022. The 1991 spectrum was multiplied by a factor 0.74 and redshifted by 9.5 Å corresponding to 2000. ± 300. km s−1.
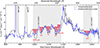 |
Fig. 21. UV absorption troughs of spectrum taken in 2022 and scaled 2013 spectrum. The 2013 spectrum has been multiplied by a factor of 0.692 and blueshifted by 2740 km s−1. The troughs of the individual absorption lines are indicated by red triangles. The shaded areas give the wavelength regions that were used for cross-correlating the wavelength shifts of the two spectra. |
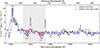 |
Fig. 22. UV absorption troughs of spectrum taken in 2022 and scaled 1991 spectrum. The 1991 spectrum has been multiplied by a factor 0.74 and redshifted by 2000 km s−1. The troughs of the Si IV λ 1403 and C IV λ 1550 absorption lines are indicated by red triangles. The shaded area gives the wavelength region that was used for cross-correlating the wavelength shifts of the two spectra. |
We derived these λ-shifts by cross-correlating the spectra in the regions where the strong absorption troughs of O VI λ 1038, S IV λ 1074, P V λ 1128, C III λ 1176, and Lyα λ1216 are present (990–1190Å), as well as Si IV λ 1403 (1340–1400 Å), for the years 2022 and 2013 (see the shaded regions in Fig. 21). Furthermore, we correlated the wavelength region that contains the absorption troughs of Si IV λ 1403 and C IV λ 1550 (1325–1550 Å; see the shaded regions in Fig. 22) to derive the shift of the 1991 spectrum with respect to the 2022 spectrum. We used the interpolation cross-correlation function (CCF) method developed by Gaskell & Peterson (1987) to calculate the λ-shifts. We generated our own CCF code (Dietrich & Kollatschny 1995, Kollatschny et al. 2018) based on similar assumptions. The derived CCFs are presented in Figs 23 and 24. The CCFs show clear and unique maxima. We determined the centroids of these CCF using only the parts of the CCFs above 80% of the peak value, rmax. A threshold value of 0.8rmax is generally a good choice, as has been shown by, for example, Peterson et al. (2004). We derived the uncertainties in our cross-correlation results based on the widths at the top of the CCFs.
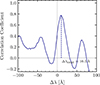 |
Fig. 23. CCF deriving wavelength shift of absorption-trough regions (see Fig. 21) of the 2013 spectrum with respect to 2022 spectrum. |
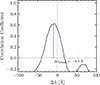 |
Fig. 24. CCF deriving wavelength shift of absorption-trough region (see Fig. 22) of 1991 spectrum with respect to 2022 spectrum. |
All the strong absorption-line troughs varied in unison in velocity space back and forward without any major changes in their absorption strengths or profiles. It is remarkable that the profiles and equivalent widths of all the absorption troughs remained so similar – despite different onset velocities – for the years 2013 and 2022. The 2013 spectrum is blueshifted by 2740 km s−1 in Fig. 21. The same trend is true when we compare the profiles and equivalent widths for the years 1991 and 2022 in Fig. 22. However, in this case the 1991 spectrum is redshifted by 2000 km s−1. Here, we see additional weak variability in the shapes of the absorption profiles. In Table 10, we present the UV-continuum fluxes at 1288 Å for the years 1991, 2013, and 2022, and the general outflow velocities of the BAL troughs with respect to the year 2022. It is immediately clear that there is no correlation between UV-continuum luminosity and the outflow velocity of the BAL troughs.
Relation between UV-continuum flux at 1288 Å and relative BAL outflow velocity.
One possible explanation for the unison redshift and subsequent blueshift of all the absorption troughs might be caused by the fact that the wind leaving the disk shares the disk rotation. The timescale of such a revolution scenario of the accretion disk is on the order of years (see, e.g., Gibson et al. 2008b). Therefore, we might see different wind shares at different epochs.
5.7. Correlations between continuum variations and BAL variations
The question remains as to whether the observed variations in the continuum flux are caused by varying absorption of the central ionizing source. However, there is no indication of dust absorption based on X-ray-continuum fitting. The X-ray spectrum – taken in 2013 – was compatible with a normal quasar power-law spectrum with moderate intrinsic absorption (Kollatschny et al. 2016). The measured low Balmer decrement also indicates low dust absorption.
It is possible that the weak X-ray flux in PG 0043+039 is intrinsic or caused by (partial) covering of the central ionizing source. Saez et al. (2021) found indications of an X-ray-wind connection in PG 2112+059. They observed a correlation between an increase of the BAL equivalent widths with a significant dimming in soft X-ray emission (⪅2keV). They claim that this is in agreement with increased absorption. They suggest a wind-shield scenario where the outflow inclination with respect to the line of sight is decreasing and/or the wind mass is increasing. BAL profiles are largely determined by the velocity-dependent geometric covering factor of saturated absorbers (Arav et al. 1999). Green et al. (2023) investigated the origin of the absorption-line variability in the nearby Seyfert galaxy WPVS 007 over seven years. They diagnosed the primary cause of the absorption-line variability in WPVS 007 to be a change in the covering fraction of the continuum by the outflow. Giustini et al. (2023) carried out a coordinated study of UV absorption troughs together with X-ray observations of PG 1126-042. They claim that the absorption from the X-ray partially covering gas and from the blueshifted C IV troughs appear to vary in a coordinated manner.
Our study shows that the UV-continuum flux decreased in PG 0043+039 by a factor of more than 1.3 between the years 2013 and 2022 (see Fig. 7) and the X-ray flux decreased by a factor of 3.4. However, the equivalent widths of the UV absorption troughs (see Fig. 21) varied only marginally after correction for the velocity shift. At first approximation we do not see a general indication for a correlation between the variation of the photoionizing continuum and the absorber variation – as it is also being discussed in QSO BAL variability studies on multiyear timescales (Gibson et al. 2008b). However, based on the simultaneous UV and X-ray observations – taken in 2013 and 2022 – we see higher maximum velocities of the blueshifted broad absorption lines in the UV when the X-ray flux was lower. Proga (2005) suggested that UV-line-driven winds may affect the X-ray corona. Gallagher et al. (2006) found a likely correlation between the maximum outflow velocity of C IV absorption and the magnitude of X-ray weakness as well. Our finding is consistent with results from Zappacosta et al. (2020), which reported an anticorrelation between the X-ray luminosities and the blueshifted velocities of the C IV emission line in a sample of luminous quasars. They interpret their results in the context of accretion disc winds that are reducing the coronal X-ray production.
6. Summary
We present combined (optical, UV, X-ray) spectral and photometric variability results of the most X-ray-faint AGN PG 0043+039 – carried out with the HST, the HET, and XMM-Newton. Our findings can be summarized as follows:
-
(1)
PG 0043+039 exhibited an extremely low X-ray luminosity and showed an extreme steep αox value of −2.47 in 2022. These values are similar to those measured in 2005. The X-ray luminosity was a factor of 3.4 higher in the meantime in 2013. The value of αox was −2.37 at that time.
-
(2)
The optical and UV continuum decreased by only a factor of 1.3–1.5 from 2013 to 2022.
-
(3)
The optical-near-UV continuum could be reproduced with a simple power law of fλ ∼ λ−α with a gradient α = 1.317 in 2022. The gradient was even stronger with a value of α = 1.69 when PG 0043+039 was in a high state in 2013. The observed continuum gradient changes to an inverted value in the far-UV at a turning point of 2400 Å at all times from 1991 till 2022.
-
(4)
Very strong emission line intensity variations by factors of eight or more were observed in the O VI λ 1038 and Si IV λ 1403 lines between 2013 and 2022. The other UV emission lines such as Lyα only decreased by a factor of 1.4. These values are affected by major errors because of additional variations of the UV absorption troughs. The optical emission lines showed only minor intensity variations in contrast to the UV lines.
-
(5)
PG 0043+039 exhibits strong and broad absorption lines in the UV. The highly ionized absorption lines show the largest velocity blueshifts in their BALs. Lower ionized BALs have smaller blueshifts.
-
(6)
The observed P V absorption is very strong, pointing to large column densities. On the other hand, the C IV trough does not reach zero intensity. This indicates that the outflowing gas only partially covers the central ionizing source. PG 0043+039 can be classified as one of the rare P V BALQs.
-
(7)
PG 0043+039 shows strong Lyα emission despite strong P V absorption. PG 0043+039 is the only source with strong Lyα in the sample of strong P V absorbers.
-
(8)
All the strong UV absorption-line troughs varied in unison in velocity space back and forward (−2000. ± 300. km s−1, +2740. ± 200. km s−1) without any major changes in absorption strength as well as in their profiles for the years 1991, 2013, and 2022.
-
(9)
We found no general correlations of the X-ray/opt/UV continuum variations with the broad absorption-line variations. However, based on the simultaneous UV and X-ray observations – taken in 2013 and 2022 – we see higher maximum velocities of the blueshifted broad absorption lines in the UV when the X-ray flux was lower.
Acknowledgments
This work has been supported by the DFG grants KO857/35-1 and KO857/35-2. This paper is based on observations obtained with the Hobby-Eberly Telescope, which is a joint project of the University of Texas at Austin, the Pennsylvania State University, Ludwig-Maximilians-Universität München, and Georg-August-Universität Göttingen. Furthermore, it is based on observations obtained with the Hubble Space Telescope and XMM-Newton, an ESA science mission with instruments and contributions directly funded by ESA Member States and NASA. This research has made use of data from the NuSTAR mission, a project led by the California Institute of Technology, managed by the Jet Propulsion Laboratory, and funded by the National Aeronautics and Space Administration. Data analysis was performed using the NuSTAR Data Analysis Software (NuSTARDAS), jointly developed by the ASI Science Data Center (SSDC, Italy) and the California Institute of Technology (USA).
References
- Arav, N., Becker, R. H., Laurent-Muehleisen, S. A., et al. 1999, ApJ, 524, 566 [NASA ADS] [CrossRef] [Google Scholar]
- Bahcall, J. N., Bergeron, J., Boksenberg, A., et al. 1993, ApJS, 87, 1 [Google Scholar]
- Ballo, L., Giustini, M., Schartel, N., et al. 2008, A&A, 483, 137 [NASA ADS] [CrossRef] [EDP Sciences] [Google Scholar]
- Ballo, L., Piconcelli, E., Vignali, C., & Schartel, N. 2011, MNRAS, 415, 2600 [Google Scholar]
- Baskin, A., & Laor, A. 2004, MNRAS, 350, L31 [NASA ADS] [CrossRef] [Google Scholar]
- Baskin, A., & Laor, A. 2005, MNRAS, 356, 1029 [NASA ADS] [CrossRef] [Google Scholar]
- Bennett, C. L., Larson, D., Weiland, J. L., & Hinshaw, G. 2014, ApJ, 794, 135 [Google Scholar]
- Bianchi, S., Piconcelli, E., Chiaberge, M., et al. 2009, ApJ, 695, 781 [Google Scholar]
- Borguet, B. C. J., Arav, N., Edmonds, D., Chamberlain, C., & Benn, C. 2013, ApJ, 762, 49 [NASA ADS] [CrossRef] [Google Scholar]
- Boroson, T. A., & Green, R. F. 1992, ApJS, 80, 109 [Google Scholar]
- Brandt, W. N., Laor, A., & Wills, B. J. 2000, ApJ, 528, 637 [CrossRef] [Google Scholar]
- Capellupo, D. M., Hamann, F., Herbst, H., et al. 2017, MNRAS, 469, 323 [Google Scholar]
- Choi, H., Leighly, K. M., Terndrup, D. M., Gallagher, S. C., & Richards, G. T. 2020, ApJ, 891, 53 [NASA ADS] [CrossRef] [Google Scholar]
- Chonis, T. S., Hill, G. J., Lee, H., et al. 2016, SPIE Conf. Ser., 9908, 99084C [NASA ADS] [Google Scholar]
- Czerny, B., Siemiginowska, A., Janiuk, A., & Gupta, A. C. 2008, MNRAS, 386, 1557 [Google Scholar]
- Dietrich, M., & Kollatschny, W. 1995, A&A, 303, 405 [NASA ADS] [Google Scholar]
- Fabian, A. C., Zoghbi, A., Wilkins, D., et al. 2012, MNRAS, 419, 116 [Google Scholar]
- Fitzpatrick, E. L. 1999, PASP, 111, 63 [Google Scholar]
- Gallagher, S. C., Brandt, W. N., Sambruna, R. M., Mathur, S., & Yamasaki, N. 1999, ApJ, 519, 549 [Google Scholar]
- Gallagher, S. C., Brandt, W. N., Chartas, G., et al. 2006, ApJ, 644, 709 [Google Scholar]
- Gaskell, C. M., & Peterson, B. M. 1987, ApJS, 65, 1 [NASA ADS] [CrossRef] [Google Scholar]
- Gibson, R. R., Brandt, W. N., & Schneider, D. P. 2008a, ApJ, 685, 773 [NASA ADS] [CrossRef] [Google Scholar]
- Gibson, R. R., Brandt, W. N., Schneider, D. P., & Gallagher, S. C. 2008b, ApJ, 675, 985 [NASA ADS] [CrossRef] [Google Scholar]
- Giustini, M., Rodríguez Hidalgo, P., Reeves, J. N., et al. 2023, A&A, 679, A73 [NASA ADS] [CrossRef] [EDP Sciences] [Google Scholar]
- Grandi, S. A. 1982, ApJ, 255, 25 [NASA ADS] [CrossRef] [Google Scholar]
- Green, R. F., Schmidt, M., & Liebert, J. 1986, ApJS, 61, 305 [NASA ADS] [CrossRef] [Google Scholar]
- Green, P. J., Schartel, N., Anderson, S. F., et al. 1995, ApJ, 450, 51 [Google Scholar]
- Green, K. S., Gallagher, S. C., Leighly, K. M., et al. 2023, ApJ, 953, 186 [Google Scholar]
- Hall, P. B., Anderson, S. F., Strauss, M. A., et al. 2002, ApJS, 141, 267 [NASA ADS] [CrossRef] [Google Scholar]
- Hamann, F., Herbst, H., Paris, I., & Capellupo, D. 2019, MNRAS, 483, 1808 [NASA ADS] [CrossRef] [Google Scholar]
- Ho, L. C., & Kim, M. 2009, ApJS, 184, 398 [NASA ADS] [CrossRef] [Google Scholar]
- Jansen, F., Lumb, D., Altieri, B., et al. 2001, A&A, 365, L1 [NASA ADS] [CrossRef] [EDP Sciences] [Google Scholar]
- Kollatschny, W., & Fricke, K. J. 1985, A&A, 146, L11 [NASA ADS] [Google Scholar]
- Kollatschny, W., Schartel, N., Zetzl, M., et al. 2015, A&A, 577, L1 [NASA ADS] [CrossRef] [EDP Sciences] [Google Scholar]
- Kollatschny, W., Schartel, N., Zetzl, M., et al. 2016, A&A, 585, A18 [NASA ADS] [CrossRef] [EDP Sciences] [Google Scholar]
- Kollatschny, W., Ochmann, M. W., Zetzl, M., et al. 2018, A&A, 619, A168 [NASA ADS] [CrossRef] [EDP Sciences] [Google Scholar]
- Kollatschny, W., Grupe, D., Parker, M. L., et al. 2023, A&A, 670, A103 [NASA ADS] [CrossRef] [EDP Sciences] [Google Scholar]
- LaMassa, S. M., Cales, S., Moran, E. C., et al. 2015, ApJ, 800, 144 [NASA ADS] [CrossRef] [Google Scholar]
- Laurenti, M., Piconcelli, E., Zappacosta, L., et al. 2022, A&A, 657, A57 [NASA ADS] [CrossRef] [EDP Sciences] [Google Scholar]
- Leighly, K. M., Hamann, F., Casebeer, D. A., & Grupe, D. 2009, ApJ, 701, 176 [Google Scholar]
- Liu, H., Luo, B., Brandt, W. N., et al. 2021, ApJ, 910, 103 [Google Scholar]
- Lockman, F. J., & Savage, B. D. 1995, ApJS, 97, 1 [Google Scholar]
- Lusso, E., Comastri, A., Vignali, C., et al. 2010, A&A, 512, A34 [NASA ADS] [CrossRef] [EDP Sciences] [Google Scholar]
- Martin, C. L., Dijkstra, M., Henry, A., et al. 2015, ApJ, 803, 6 [Google Scholar]
- Martocchia, S., Piconcelli, E., Zappacosta, L., et al. 2017, A&A, 608, A51 [NASA ADS] [CrossRef] [EDP Sciences] [Google Scholar]
- Marziani, P., & Sulentic, J. W. 2014, MNRAS, 442, 1211 [NASA ADS] [CrossRef] [Google Scholar]
- Marziani, P., Sulentic, J. W., Dultzin-Hacyan, D., Calvani, M., & Moles, M. 1996, ApJS, 104, 37 [Google Scholar]
- Meusinger, H., Schalldach, P., Mirhosseini, A., & Pertermann, F. 2016, A&A, 587, A83 [NASA ADS] [CrossRef] [EDP Sciences] [Google Scholar]
- Netzer, H. 2019, MNRAS, 488, 5185 [NASA ADS] [CrossRef] [Google Scholar]
- Pandey, A., Martínez-Aldama, M. L., Czerny, B., Panda, S., & Zajaček, M. 2024, arXiv e-prints [arXiv:2401.18052] [Google Scholar]
- Peterson, B. M., Ferrarese, L., Gilbert, K. M., et al. 2004, ApJ, 613, 682 [Google Scholar]
- Poole, T. S., Breeveld, A. A., Page, M. J., et al. 2008, MNRAS, 383, 627 [Google Scholar]
- Proga, D. 2005, ApJ, 630, L9 [NASA ADS] [CrossRef] [Google Scholar]
- Pu, X., Luo, B., Brandt, W. N., et al. 2020, ApJ, 900, 141 [Google Scholar]
- Risaliti, G., Elvis, M., Fabbiano, G., Baldi, A., & Zezas, A. 2005, ApJ, 623, L93 [Google Scholar]
- Saez, C., Brandt, W. N., Gallagher, S. C., Bauer, F. E., & Garmire, G. P. 2012, ApJ, 759, 42 [NASA ADS] [CrossRef] [Google Scholar]
- Saez, C., Brandt, W. N., Bauer, F. E., et al. 2021, MNRAS, 506, 343 [NASA ADS] [CrossRef] [Google Scholar]
- Schartel, N., Rodríguez-Pascual, P. M., Santos-Lleó, M., et al. 2007, A&A, 474, 431 [NASA ADS] [CrossRef] [EDP Sciences] [Google Scholar]
- Schartel, N., Rodríguez-Pascual, P. M., Santos-Lleó, M., et al. 2010, A&A, 512, A75 [NASA ADS] [CrossRef] [EDP Sciences] [Google Scholar]
- Schlafly, E. F., & Finkbeiner, D. P. 2011, ApJ, 737, 103 [Google Scholar]
- Schlegel, D. J., Finkbeiner, D. P., & Davis, M. 1998, ApJ, 500, 525 [Google Scholar]
- Shappee, B. J., Prieto, J. L., Grupe, D., et al. 2014, ApJ, 788, 48 [Google Scholar]
- Shull, J. M., Stevans, M., & Danforth, C. W. 2012, ApJ, 752, 162 [NASA ADS] [CrossRef] [Google Scholar]
- Sigut, T. A. A., & Pradhan, A. K. 2003, ApJS, 145, 15 [Google Scholar]
- Steffen, A. T., Strateva, I., Brandt, W. N., et al. 2006, AJ, 131, 2826 [Google Scholar]
- Strateva, I. V., Brandt, W. N., Schneider, D. P., Vanden Berk, D. G., & Vignali, C. 2005, AJ, 130, 387 [Google Scholar]
- Strüder, L., Briel, U., Dennerl, K., et al. 2001, A&A, 365, L18 [Google Scholar]
- Trakhtenbrot, B., & Netzer, H. 2012, MNRAS, 427, 3081 [NASA ADS] [CrossRef] [Google Scholar]
- Turner, M. J. L., Abbey, A., Arnaud, M., et al. 2001, A&A, 365, L27 [CrossRef] [EDP Sciences] [Google Scholar]
- Turnshek, D. A., Espey, B. R., Kopko, M., Jr, et al. 1994, ApJ, 428, 93 [Google Scholar]
- Turnshek, D. A., Monier, E. M., Sirola, C. J., & Espey, B. R. 1997, ApJ, 476, 40 [Google Scholar]
- Veilleux, S., Trippe, M., Hamann, F., et al. 2013, ApJ, 764, 15 [NASA ADS] [CrossRef] [Google Scholar]
- Veilleux, S., Rupke, D. S. N., Liu, W., et al. 2022, ApJ, 926, 60 [NASA ADS] [CrossRef] [Google Scholar]
- Webb, N. A., Coriat, M., Traulsen, I., et al. 2020, A&A, 641, A136 [NASA ADS] [CrossRef] [EDP Sciences] [Google Scholar]
- Wilkes, B. J., Tananbaum, H., Worrall, D. M., et al. 1994, ApJS, 92, 53 [NASA ADS] [CrossRef] [Google Scholar]
- Wills, B. J., Netzer, H., & Wills, D. 1985, ApJ, 288, 94 [NASA ADS] [CrossRef] [Google Scholar]
- Wright, E. L. 2006, PASP, 118, 1711 [NASA ADS] [CrossRef] [Google Scholar]
- Zappacosta, L., Piconcelli, E., Giustini, M., et al. 2020, A&A, 635, L5 [NASA ADS] [CrossRef] [EDP Sciences] [Google Scholar]
All Tables
Emission line and continuum intensities in rest frame and corrected for Galactic extinction for the years 1991 up to 2024.
X-ray, UV, and optical continuum flux variations, as well as αox and L2keV variations.
Measured line widths (FWHM) and shifts (uppermost 10%) of the strongest broad emission lines.
UV absorption trough equivalent widths, outflow velocities (max/min), FWHM, and their depths.
Relation between UV-continuum flux at 1288 Å and relative BAL outflow velocity.
All Figures
|
Fig. 1. Hubble Space Telescope UV spectrum of PG 0043+039 taken in July, 2022. The location of possible emission lines is indicated above the spectrum (in black). Absorption troughs are indicated below the spectrum (in red). |
| In the text | |
|
Fig. 2. Observed optical spectrum of PG 0043+039 from July, 2022. |
| In the text | |
|
Fig. 3. Combined UV-optical spectrum of PG 0043+039 in 2022. A power-law model (in red) was fit to the continuum, giving a spectral index of α = 1.317. The spectral regions that were used for deriving the power-law slope of the continuum are shown in gray. |
| In the text | |
|
Fig. 4. Optical spectra of PG 0043+039 taken in 2022, as well as in the years 2013, 2019, and 2024. |
| In the text | |
|
Fig. 5. Mean optical spectrum of PG 0043+039 based on years 2013, 2019, 2022, and 2024. The mean spectrum shortward of 3173 Å (dashed line) is lower because it is based on three spectra only (2019, 2022, 2024). |
| In the text | |
|
Fig. 6. Optical rms spectrum of PG 0043+039 based on years 2013, 2019, 2022, and 2024. The overlapping region of the UV and Orange channels of the LRS2-B spectrograph is shown in gray. The rms spectrum shortward of 3173 Å (dashed line) is based on three spectra only (2019, 2022, 2024). |
| In the text | |
|
Fig. 7. HST UV spectra of PG 0043+039 taken in years 1991, 2013, and 2022. |
| In the text | |
|
Fig. 8. HST UV mean spectrum of PG 0043+039 for years 1991, 2013, and 2022. |
| In the text | |
|
Fig. 9. HST UV difference spectra for 1991 and 2013 with respect to the minimum spectrum from 2022. |
| In the text | |
|
Fig. 10. UV and optical spectra of PG 0043+039 for 2013 and 2022, as well as modeled power-law spectra based on the optical continuum data for 2013 and 2022. In addition, the UV spectrum taken in 1991 is shown. |
| In the text | |
|
Fig. 11. αox gradient as function of monochromatic luminosity at rest frame 2500 Å. Black dots mark the SDSS objects from Strateva et al. (2005), while gray filled circles mark the data from Steffen et al. (2006). Further measurements of extreme X-ray weak quasars are indicated by cyan pentagons (Saez et al. 2012), blue and yellow open triangles (Schartel et al. 2010, 2007; Ballo et al. 2011), dark blue filled triangles (Laurenti et al. 2022), and magenta open diamonds (Zappacosta et al. 2020). The positions of PG 0043+039 are highlighted for the years 2005 (red square), 2013 (black circle), and 2022 (filled purple hexagon). The solid black line gives the best-fit relation from Lusso et al. (2010) with the 1σ spread (dashed lines) (see Fig. 5 in Laurenti et al. 2022). The blue line is the best-fit relation from Martocchia et al. (2017). The solid green line marks the line for X-ray weakness (Pu et al. 2020). |
| In the text | |
|
Fig. 12. αox gradient as function of Eddington luminosity log λEdd. The position of PG 0043+039 (in the year 2022) is highlighted (filled purple hexagon). The other AGNs are from Laurenti et al. (2022), Lusso et al. (2010), Liu et al. (2021), and Zappacosta et al. (2020) divided into different regimes of bolometric luminosity as presented by Laurenti et al. (2022) (their Fig. 5, right panel). The solid line represents the best-fit relation from Lusso et al. (2010). The dashed lines give the 1σ spread of their relation. |
| In the text | |
|
Fig. 13. Scaled Hβ line profiles for the epochs 2013, 2019, 2022, and 2024. |
| In the text | |
|
Fig. 14. Scaled mean Balmer and Lyα emission-line profiles. |
| In the text | |
|
Fig. 15. Scaled mean Balmer and Si IIλ1308 (1991) emission-line profiles. |
| In the text | |
|
Fig. 16. Scaled mean Hβ, O VIλ1038, and Mg IIλ2800 emission-line profiles. |
| In the text | |
|
Fig. 17. Scaled mean Mg IIλ2800 and N Vλ1243 (2013) emission-line profiles. |
| In the text | |
|
Fig. 18. UV absorption-line troughs in 2022. |
| In the text | |
|
Fig. 19. UV absorption-line troughs in 2013. |
| In the text | |
|
Fig. 20. UV absorption-line troughs in 1991. |
| In the text | |
|
Fig. 21. UV absorption troughs of spectrum taken in 2022 and scaled 2013 spectrum. The 2013 spectrum has been multiplied by a factor of 0.692 and blueshifted by 2740 km s−1. The troughs of the individual absorption lines are indicated by red triangles. The shaded areas give the wavelength regions that were used for cross-correlating the wavelength shifts of the two spectra. |
| In the text | |
|
Fig. 22. UV absorption troughs of spectrum taken in 2022 and scaled 1991 spectrum. The 1991 spectrum has been multiplied by a factor 0.74 and redshifted by 2000 km s−1. The troughs of the Si IV λ 1403 and C IV λ 1550 absorption lines are indicated by red triangles. The shaded area gives the wavelength region that was used for cross-correlating the wavelength shifts of the two spectra. |
| In the text | |
|
Fig. 23. CCF deriving wavelength shift of absorption-trough regions (see Fig. 21) of the 2013 spectrum with respect to 2022 spectrum. |
| In the text | |
|
Fig. 24. CCF deriving wavelength shift of absorption-trough region (see Fig. 22) of 1991 spectrum with respect to 2022 spectrum. |
| In the text | |
Current usage metrics show cumulative count of Article Views (full-text article views including HTML views, PDF and ePub downloads, according to the available data) and Abstracts Views on Vision4Press platform.
Data correspond to usage on the plateform after 2015. The current usage metrics is available 48-96 hours after online publication and is updated daily on week days.
Initial download of the metrics may take a while.