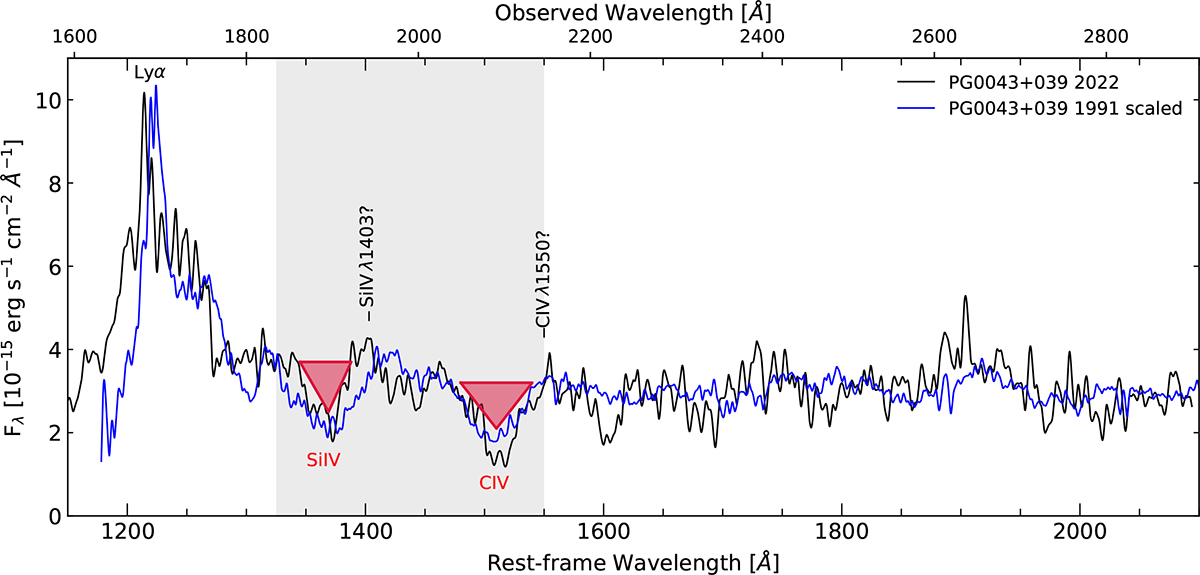
Fig. 22.
Download original image
UV absorption troughs of spectrum taken in 2022 and scaled 1991 spectrum. The 1991 spectrum has been multiplied by a factor 0.74 and redshifted by 2000 km s−1. The troughs of the Si IV λ 1403 and C IV λ 1550 absorption lines are indicated by red triangles. The shaded area gives the wavelength region that was used for cross-correlating the wavelength shifts of the two spectra.
Current usage metrics show cumulative count of Article Views (full-text article views including HTML views, PDF and ePub downloads, according to the available data) and Abstracts Views on Vision4Press platform.
Data correspond to usage on the plateform after 2015. The current usage metrics is available 48-96 hours after online publication and is updated daily on week days.
Initial download of the metrics may take a while.