Fig. 11
Download original image
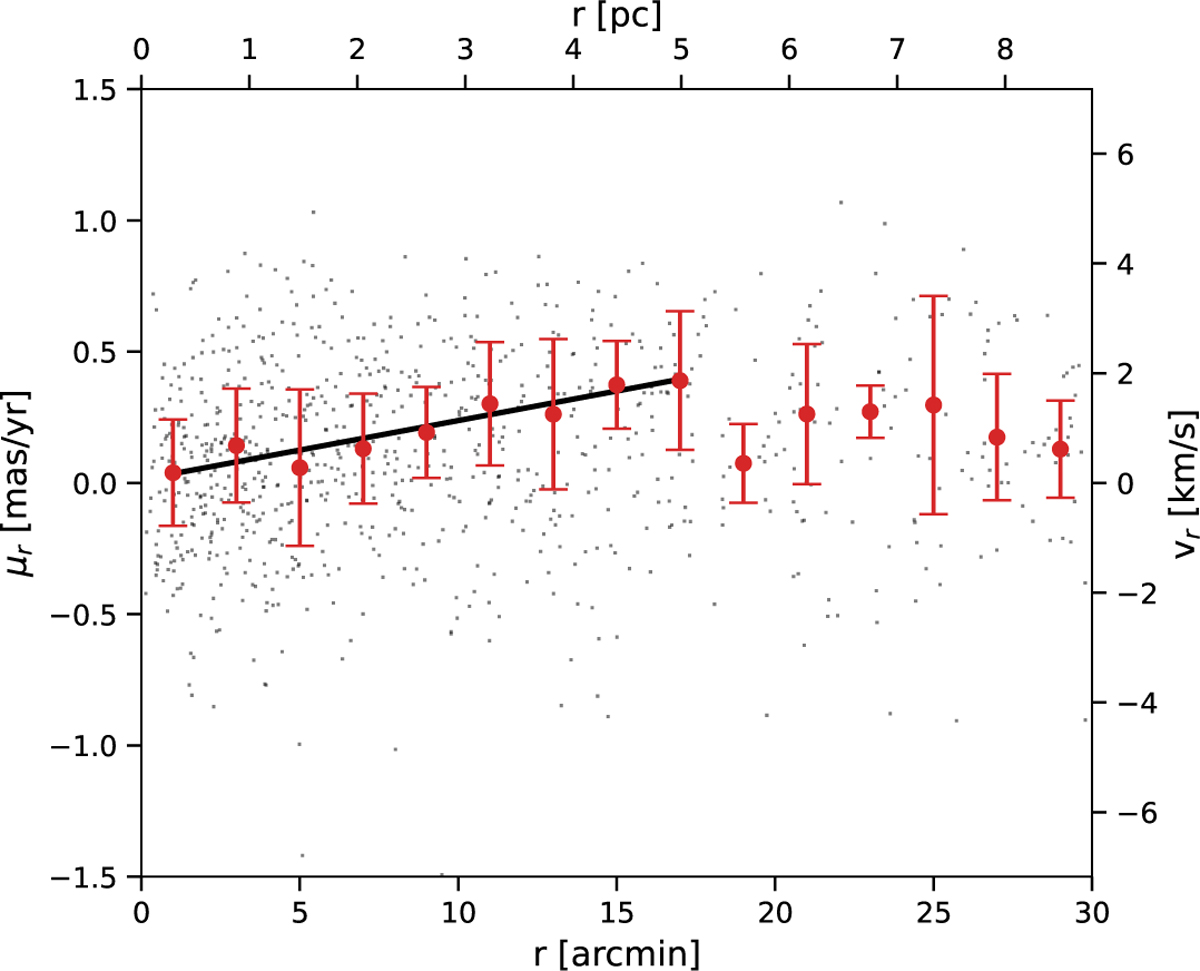
Radial component of the relative proper motion (μr) as a function of distance from the center of Berkeley 59. The red points and error bars show the values of μr in 2′ bins, calculated as the weighted mean and standard deviation, respectively. A distance of 1009 pc was assumed for the top and right axes. Positive values of μr indicate expansion. The black line shows a linear fit to the red points inside the radius of 18′ and has a slope of 0.022 ± 0.003 mas yr−1 arcmin−1 and an intercept of 0.013 ± 0.028 mas yr−1.
Current usage metrics show cumulative count of Article Views (full-text article views including HTML views, PDF and ePub downloads, according to the available data) and Abstracts Views on Vision4Press platform.
Data correspond to usage on the plateform after 2015. The current usage metrics is available 48-96 hours after online publication and is updated daily on week days.
Initial download of the metrics may take a while.