Open Access
Fig. 12
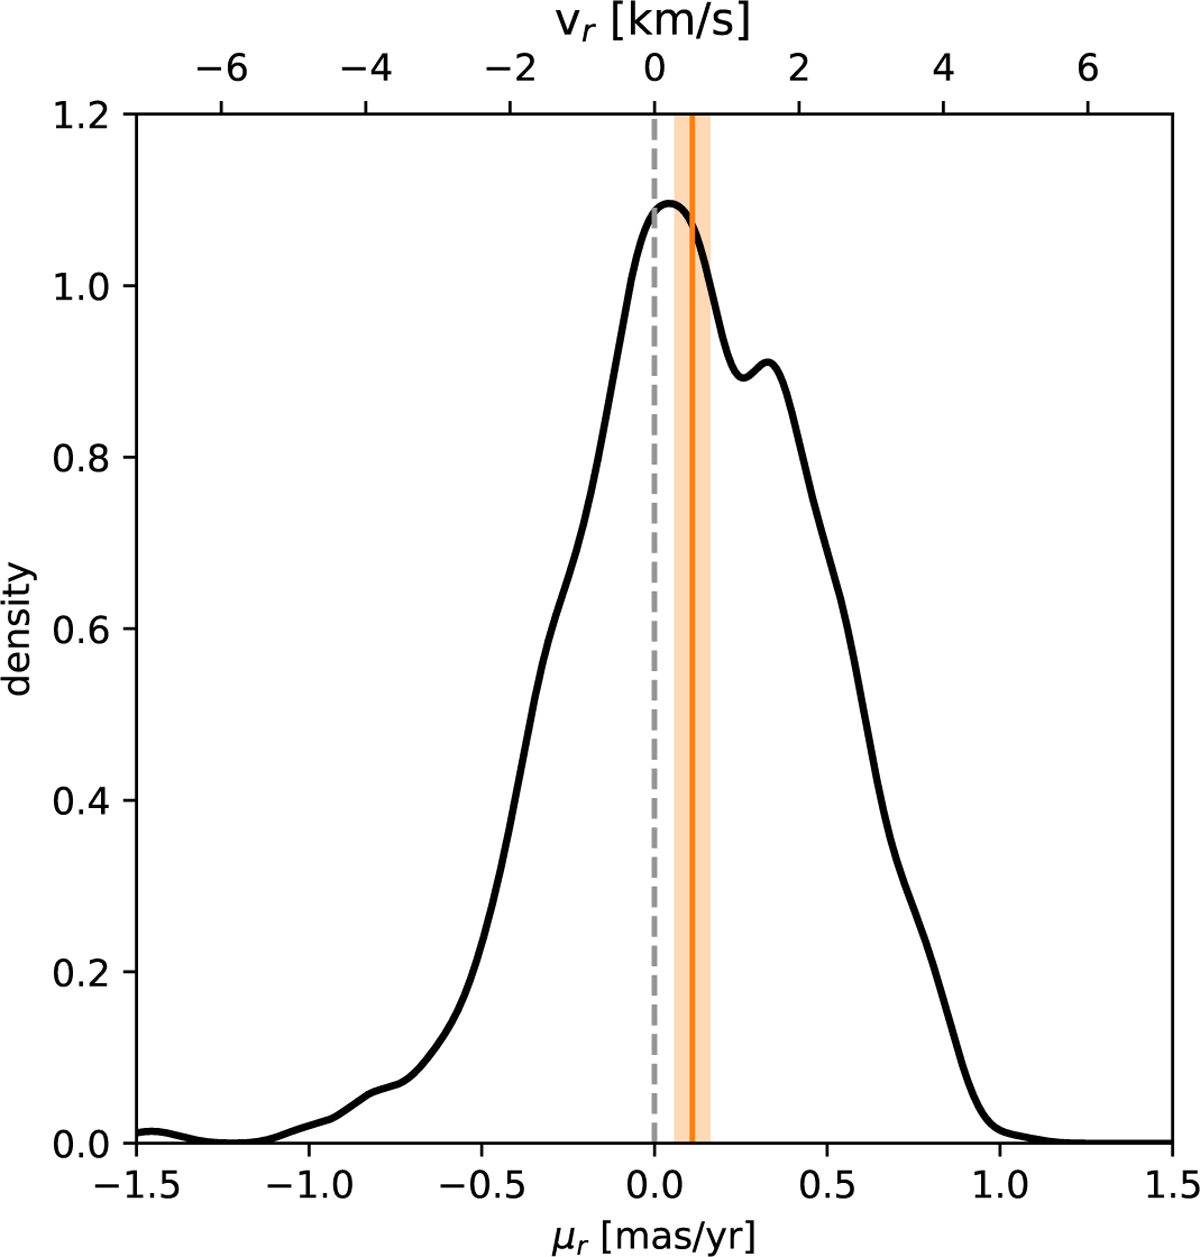
Download original image
Distribution of the radial component of the relative proper motion vector for Berkeley 59 (r ≤ 18′). The dashed gray line marks the velocity of zero, the vertical solid orange line represents the median of the distribution, and the orange shaded area spans a 3σ range around the median.
Current usage metrics show cumulative count of Article Views (full-text article views including HTML views, PDF and ePub downloads, according to the available data) and Abstracts Views on Vision4Press platform.
Data correspond to usage on the plateform after 2015. The current usage metrics is available 48-96 hours after online publication and is updated daily on week days.
Initial download of the metrics may take a while.