Open Access
Fig. C.1
Download original image
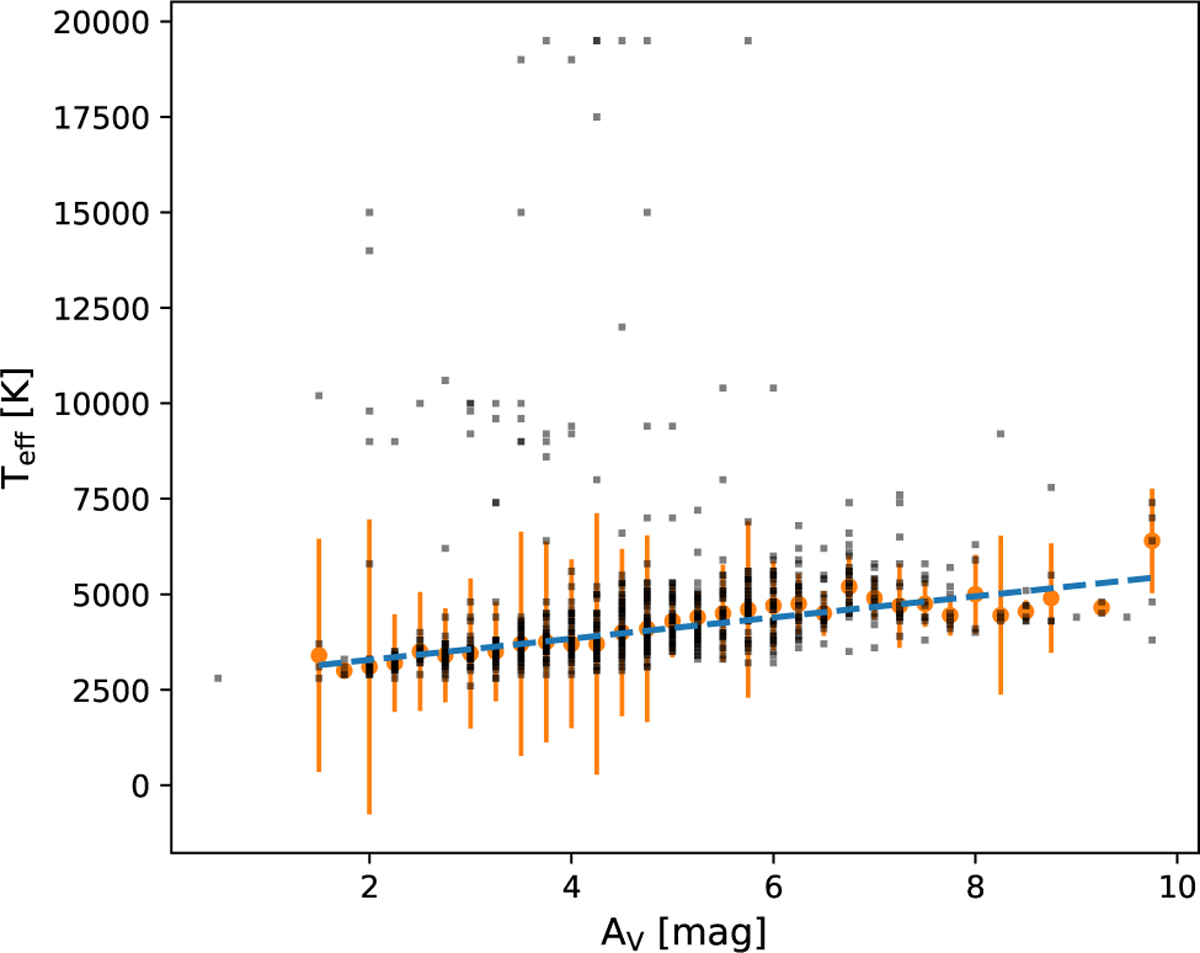
The relationship between the Teff and AV obtained from the SED fitting in Section 4.2 (black dots). The orange points represent the median value Teff values at each step of the extinction grid, with error bars indicating the standard deviation. The blue dashed line corresponds to a linear fit to the orange points.
Current usage metrics show cumulative count of Article Views (full-text article views including HTML views, PDF and ePub downloads, according to the available data) and Abstracts Views on Vision4Press platform.
Data correspond to usage on the plateform after 2015. The current usage metrics is available 48-96 hours after online publication and is updated daily on week days.
Initial download of the metrics may take a while.