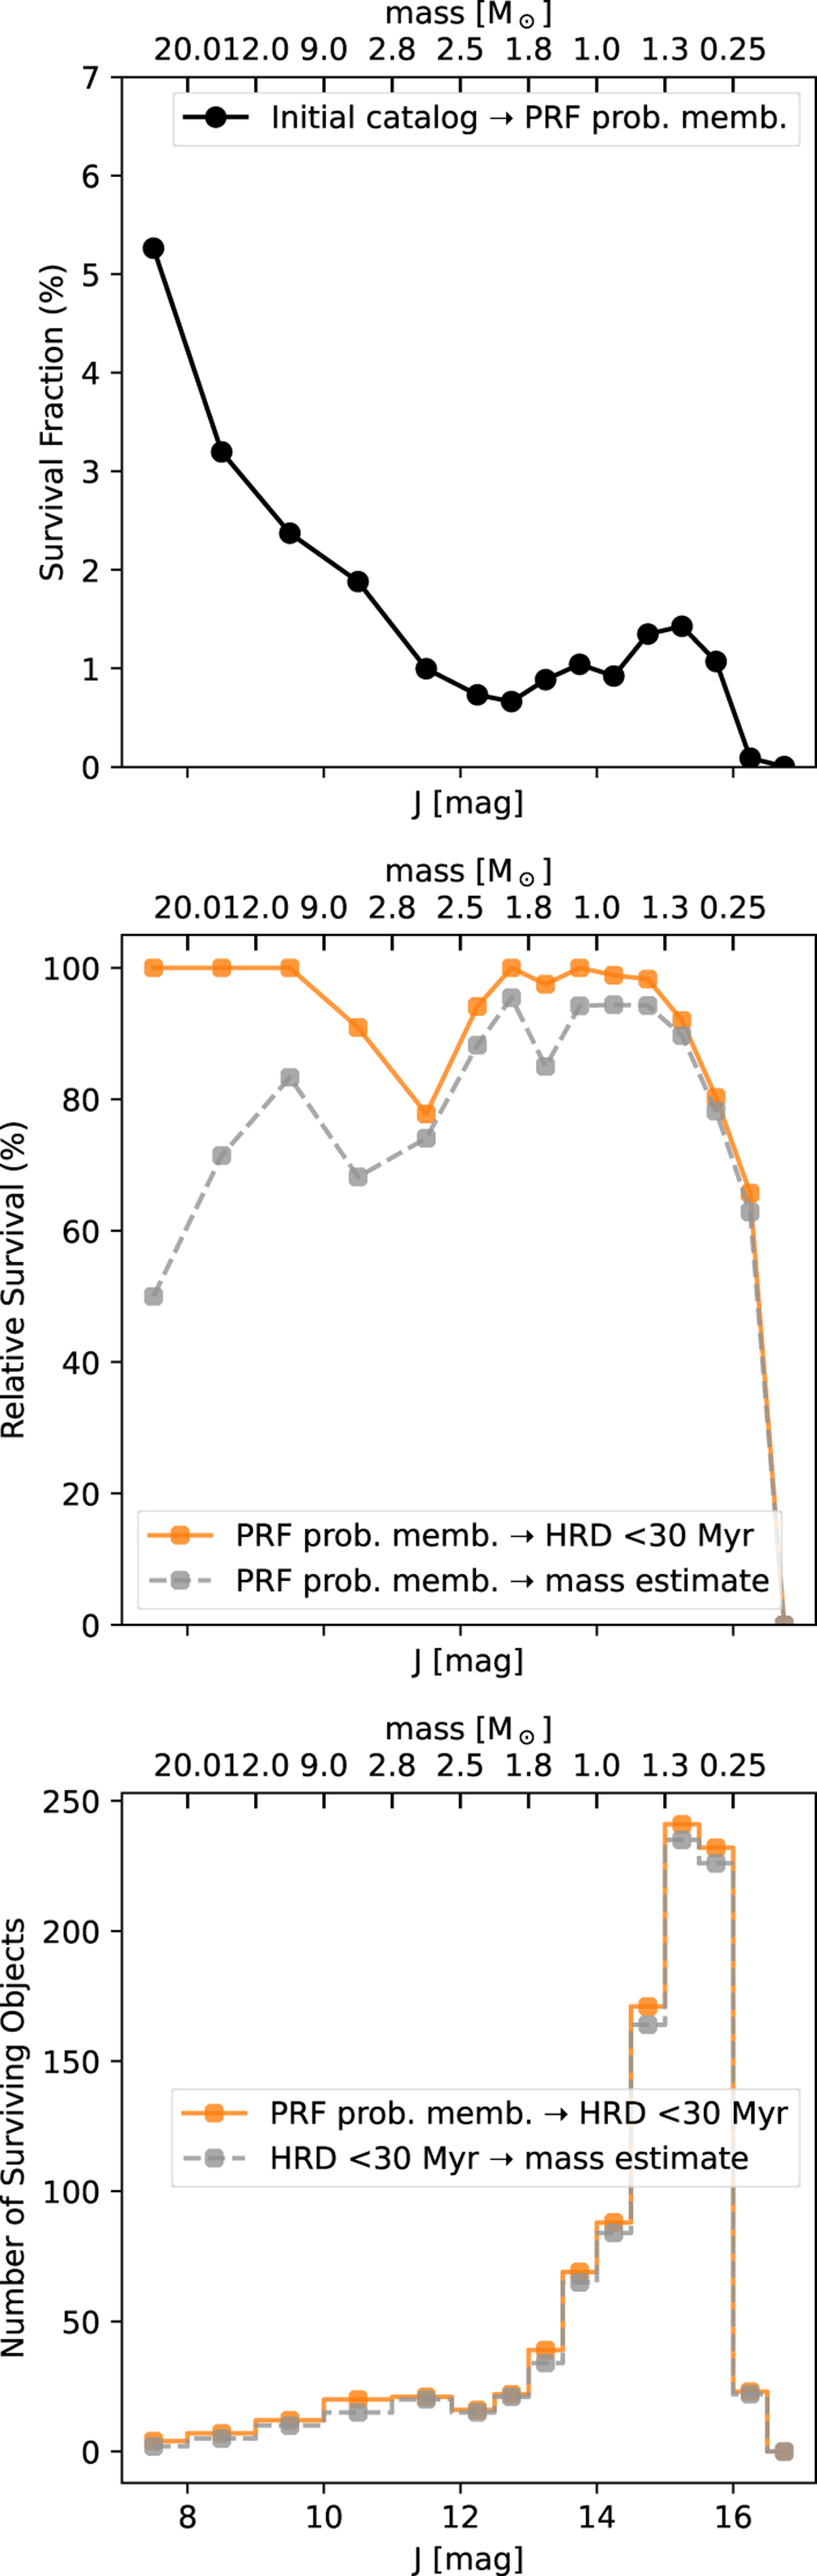
Fig. D.1
Download original image
Selection effects as a function of J–band magnitude across different stages of the sample construction. For this plot, we removed the southern part of the field (δ < 66.8°). Top: Fraction of objects surviving the main selection step (PRF classification). Middle: Percentage of objects remaining at each magnitude step relative to the sample of probable members from the PRF run. The orange symbols show the percentage of surviving objects after removing the objects older than 30 Myr (Section. 4.2), and the gray symbols show those with valid mass estimates (Section. 6.1). Bottom: Same as the middle panel, but showing the number of objects instead of percentages. Tick marks on the top x-axis indicate approximate stellar masses corresponding to J–band magnitudes at the distance of Berkeley 59, age of 2 Myr and extinction AV = 4 mag.
Current usage metrics show cumulative count of Article Views (full-text article views including HTML views, PDF and ePub downloads, according to the available data) and Abstracts Views on Vision4Press platform.
Data correspond to usage on the plateform after 2015. The current usage metrics is available 48-96 hours after online publication and is updated daily on week days.
Initial download of the metrics may take a while.