Fig. 3
Download original image
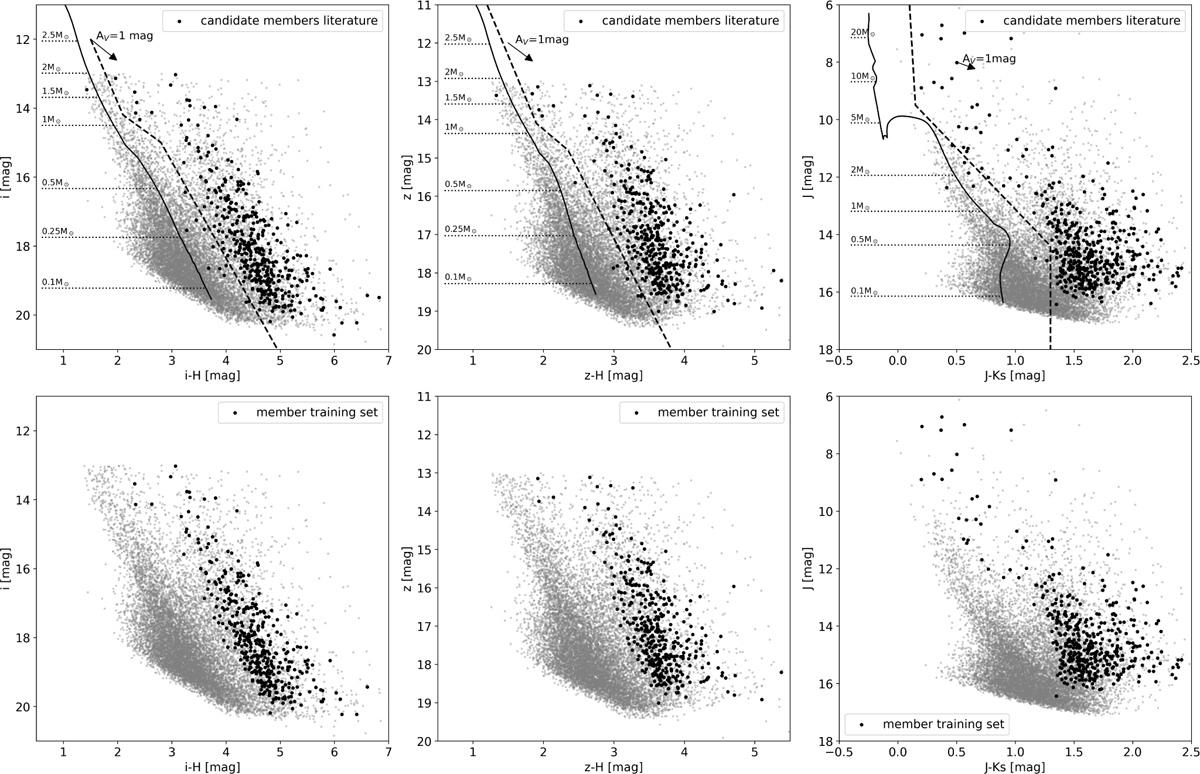
Color–magnitude diagrams we used to select the training set. The black dots in the top panels show candidate members from the literature, and the gray dots mark all the sources in the field. The dashed lines show the selection criteria, and the solid lines represent the 2 Myr PARSEC isochrones, shifted to a distance of 1100 pc (Kuhn et al. 2019). In the lower panels, the black dots represent the probable members we selected for the training set after the proper motion, color, and parallax filters.
Current usage metrics show cumulative count of Article Views (full-text article views including HTML views, PDF and ePub downloads, according to the available data) and Abstracts Views on Vision4Press platform.
Data correspond to usage on the plateform after 2015. The current usage metrics is available 48-96 hours after online publication and is updated daily on week days.
Initial download of the metrics may take a while.