Fig. 4
Download original image
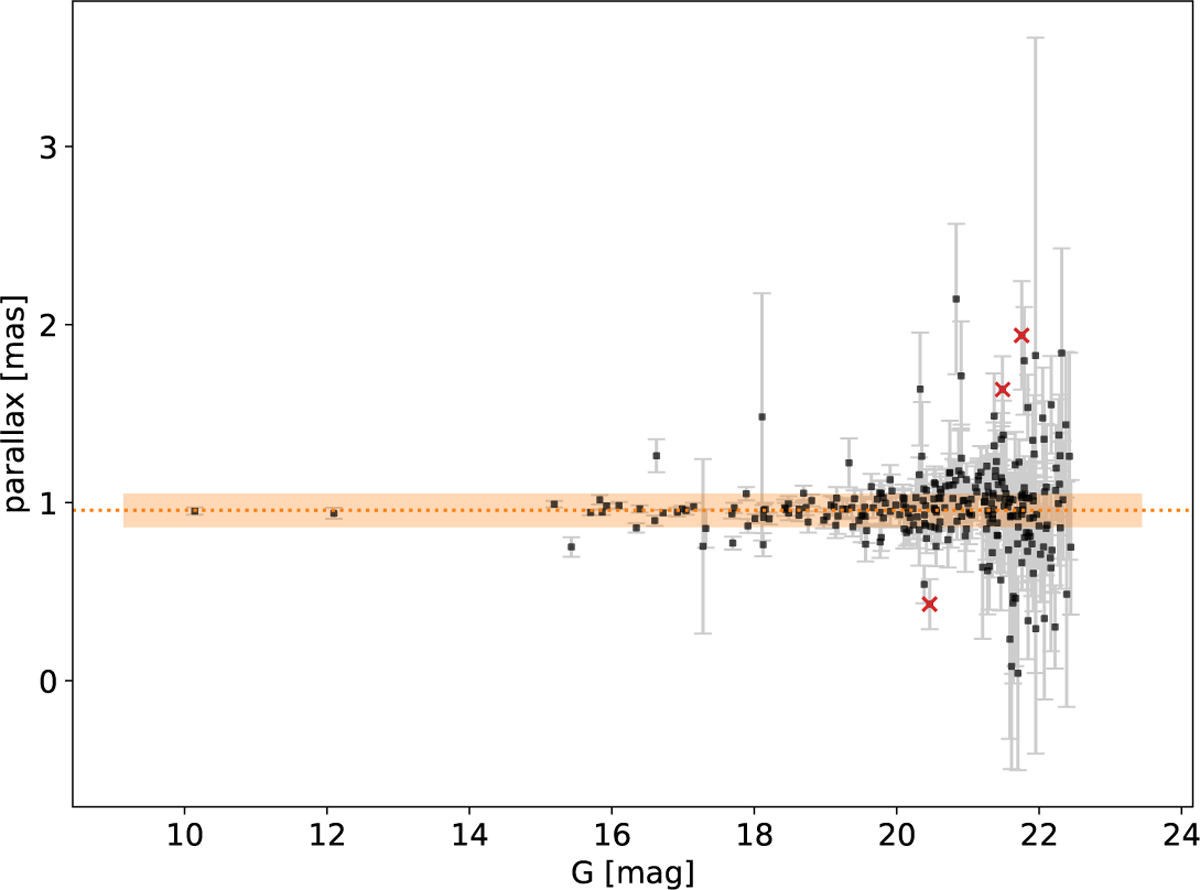
Parallax measurements for the candidates of the member training set, selected based on proper motions and colors (black dots). The dotted orange line represents the weighted average of the parallaxes, and the shaded area marks the ±1σ range. The red crosses mark the sources that were excluded from the final member training set (see text for the details of the criterion we applied).
Current usage metrics show cumulative count of Article Views (full-text article views including HTML views, PDF and ePub downloads, according to the available data) and Abstracts Views on Vision4Press platform.
Data correspond to usage on the plateform after 2015. The current usage metrics is available 48-96 hours after online publication and is updated daily on week days.
Initial download of the metrics may take a while.