Fig. 5
Download original image
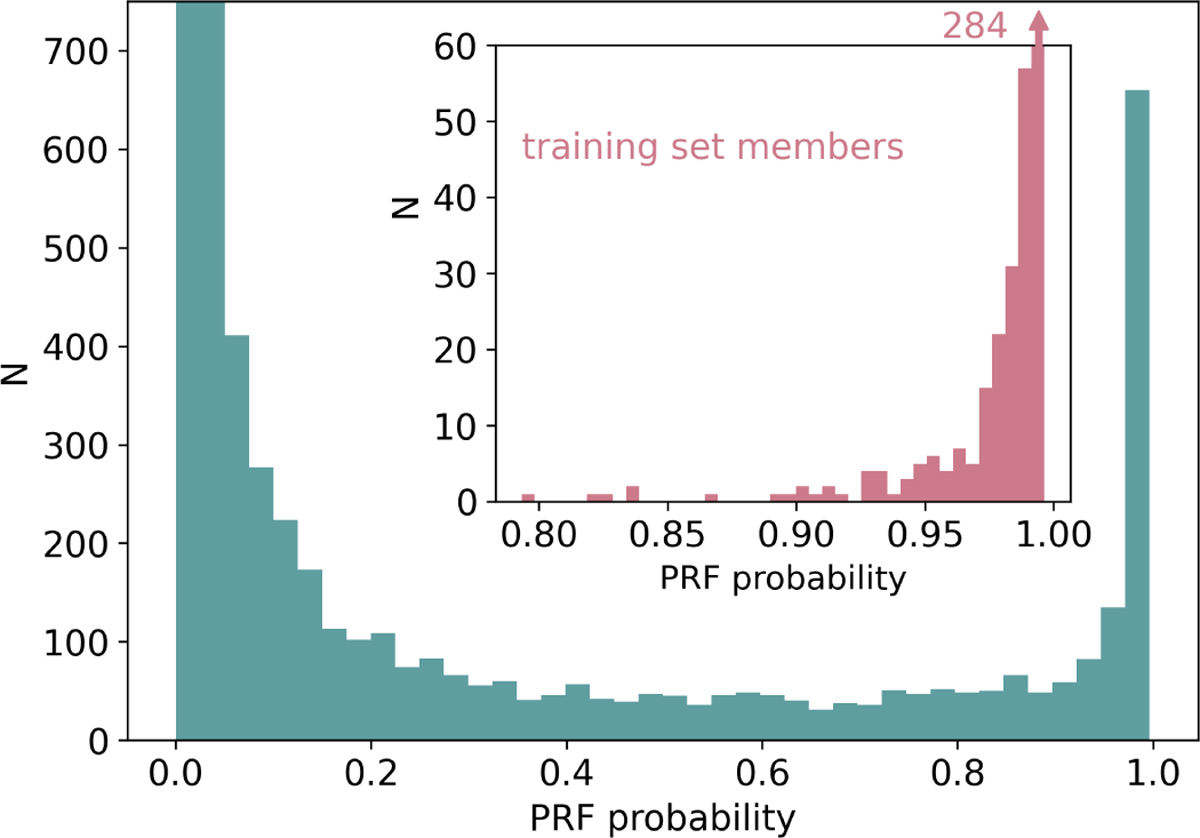
Distribution of the membership probability of the final catalog limited to objects 30′ from the center for clarity. The four leftmost columns are capped for better readability. The inset diagram shows the prediction for all objects labeled as members in the training set. The rightmost column of the inset diagram is capped, and its value is depicted next to it.
Current usage metrics show cumulative count of Article Views (full-text article views including HTML views, PDF and ePub downloads, according to the available data) and Abstracts Views on Vision4Press platform.
Data correspond to usage on the plateform after 2015. The current usage metrics is available 48-96 hours after online publication and is updated daily on week days.
Initial download of the metrics may take a while.