Fig. 6
Download original image
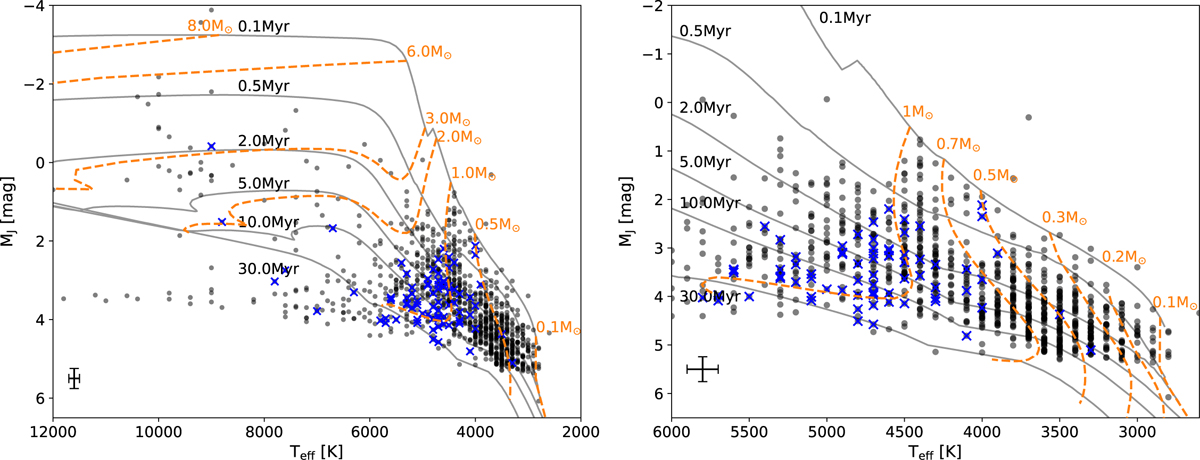
Hertzsprung-Russell diagram showing the candidates with membership probabilities ≥90% (black dots). The blue crosses mark candidates located in the southern filaments (see Sect. 4.3). The isochrones (solid gray lines) and the lines of constant mass (dashed orange lines) are from the PARSEC series (Bressan et al. 2012; Pastorelli et al. 2020). A typical error bar is shown in the lower left corner. Objects located below the 30 Myr isochrone are considered contaminants. The right panel is the zoomed-in version of the left panel.
Current usage metrics show cumulative count of Article Views (full-text article views including HTML views, PDF and ePub downloads, according to the available data) and Abstracts Views on Vision4Press platform.
Data correspond to usage on the plateform after 2015. The current usage metrics is available 48-96 hours after online publication and is updated daily on week days.
Initial download of the metrics may take a while.