Fig. 7
Download original image
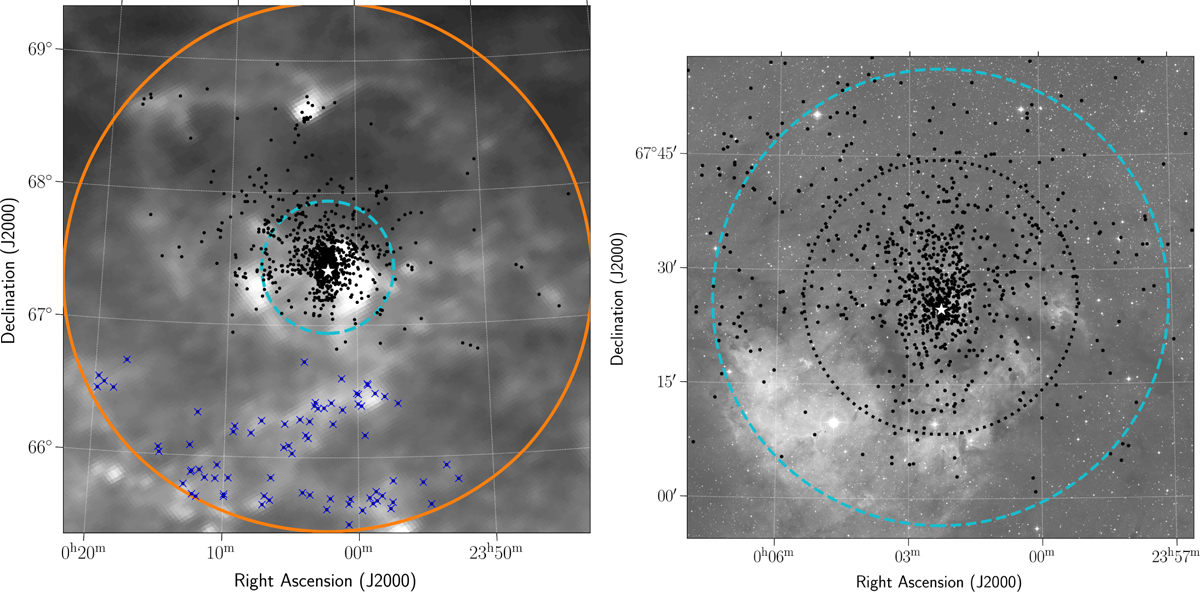
Sources with membership probabilities ≥90% and consistent with ages <30 Myr (black dots) overplotted on the Planck 857 GHz image (left) and DSS red image (right) of the region around Berkeley 56. The sources that are likely located in the background, associated with the southern filaments, are marked with blue crosses. The solid orange circle encompasses the entire region (r=2°), the dashed blue circle shows the region in which the training sample was selected (r=30′), and the dotted black circle shows an extent of the cluster as derived from the radial profile (r=18′). The white star shows the position of the center of Berkeley 59 derived in Section 5.1.
Current usage metrics show cumulative count of Article Views (full-text article views including HTML views, PDF and ePub downloads, according to the available data) and Abstracts Views on Vision4Press platform.
Data correspond to usage on the plateform after 2015. The current usage metrics is available 48-96 hours after online publication and is updated daily on week days.
Initial download of the metrics may take a while.