Fig. 9
Download original image
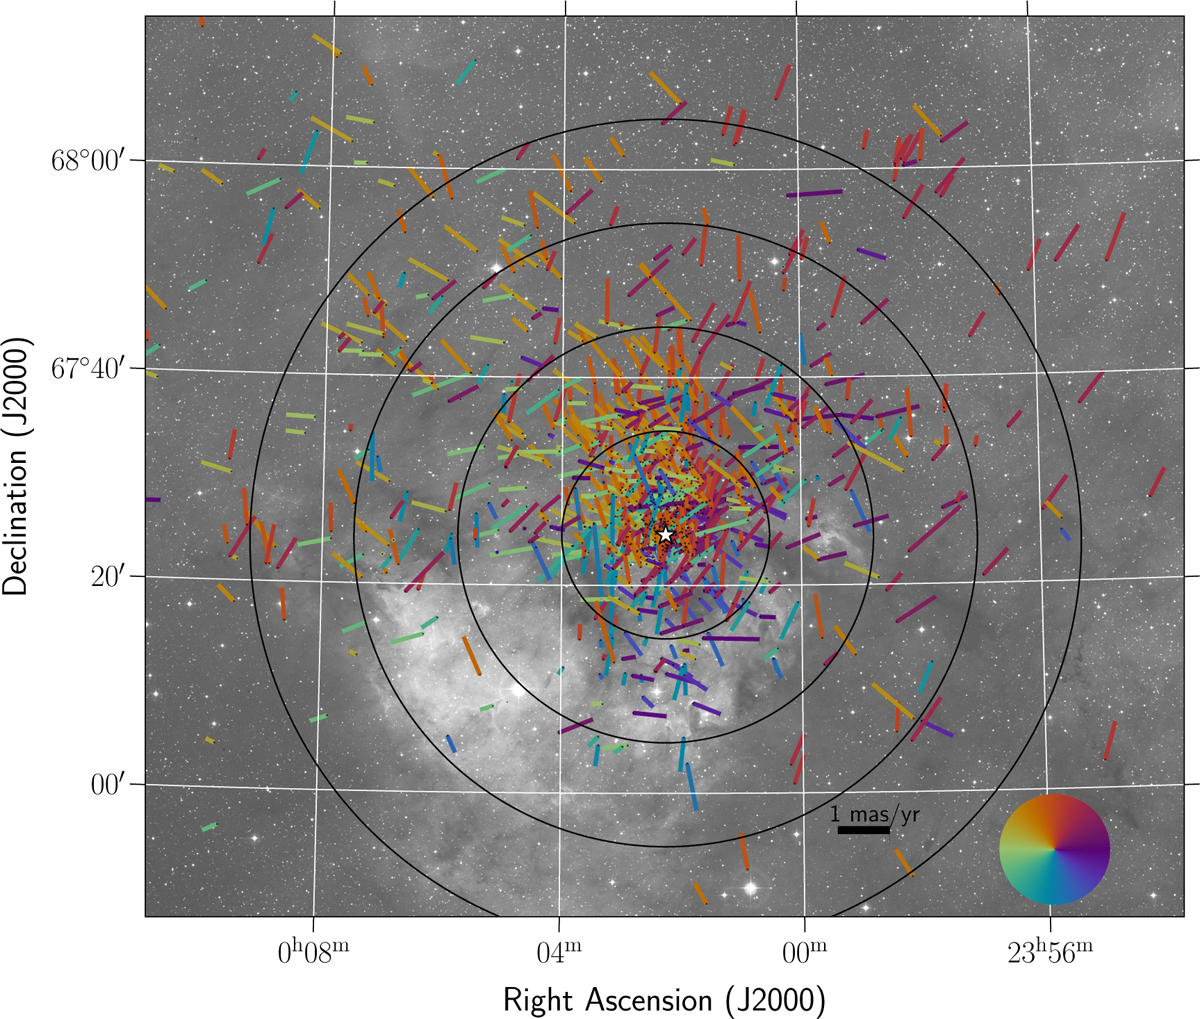
Relative proper motion vectors of the stars in Berkeley 59 shown overplotted on a DSS red image. The color and direction of the bars extending from the black dots (the sources) indicate the direction of the movement. The concentric circles mark radii of (10, 20, 30, 40)′ from the center. The white star marks the highest surface density, which we took as the center. For a zoomed-in version see Fig. B.1.
Current usage metrics show cumulative count of Article Views (full-text article views including HTML views, PDF and ePub downloads, according to the available data) and Abstracts Views on Vision4Press platform.
Data correspond to usage on the plateform after 2015. The current usage metrics is available 48-96 hours after online publication and is updated daily on week days.
Initial download of the metrics may take a while.